React Tornado Viewer
Visualizing tornado forecast models for meteorologists
I completed this visualization for the Machine Integration and Learning for Earth Systems (MILES) group at the National Center for Atmospheric Research (NCAR) in Winter 2023.
In weather forecasting, init time refers to the time at which a model run is initialized, while valid time refers to the time whose weather the model is predicting for.
Sometimes, forecasters may be interested in how models for the same valid time may change over the course of different init times - for example, does a model get more accurate as it is ran closer to the time it is attempting to forecast?
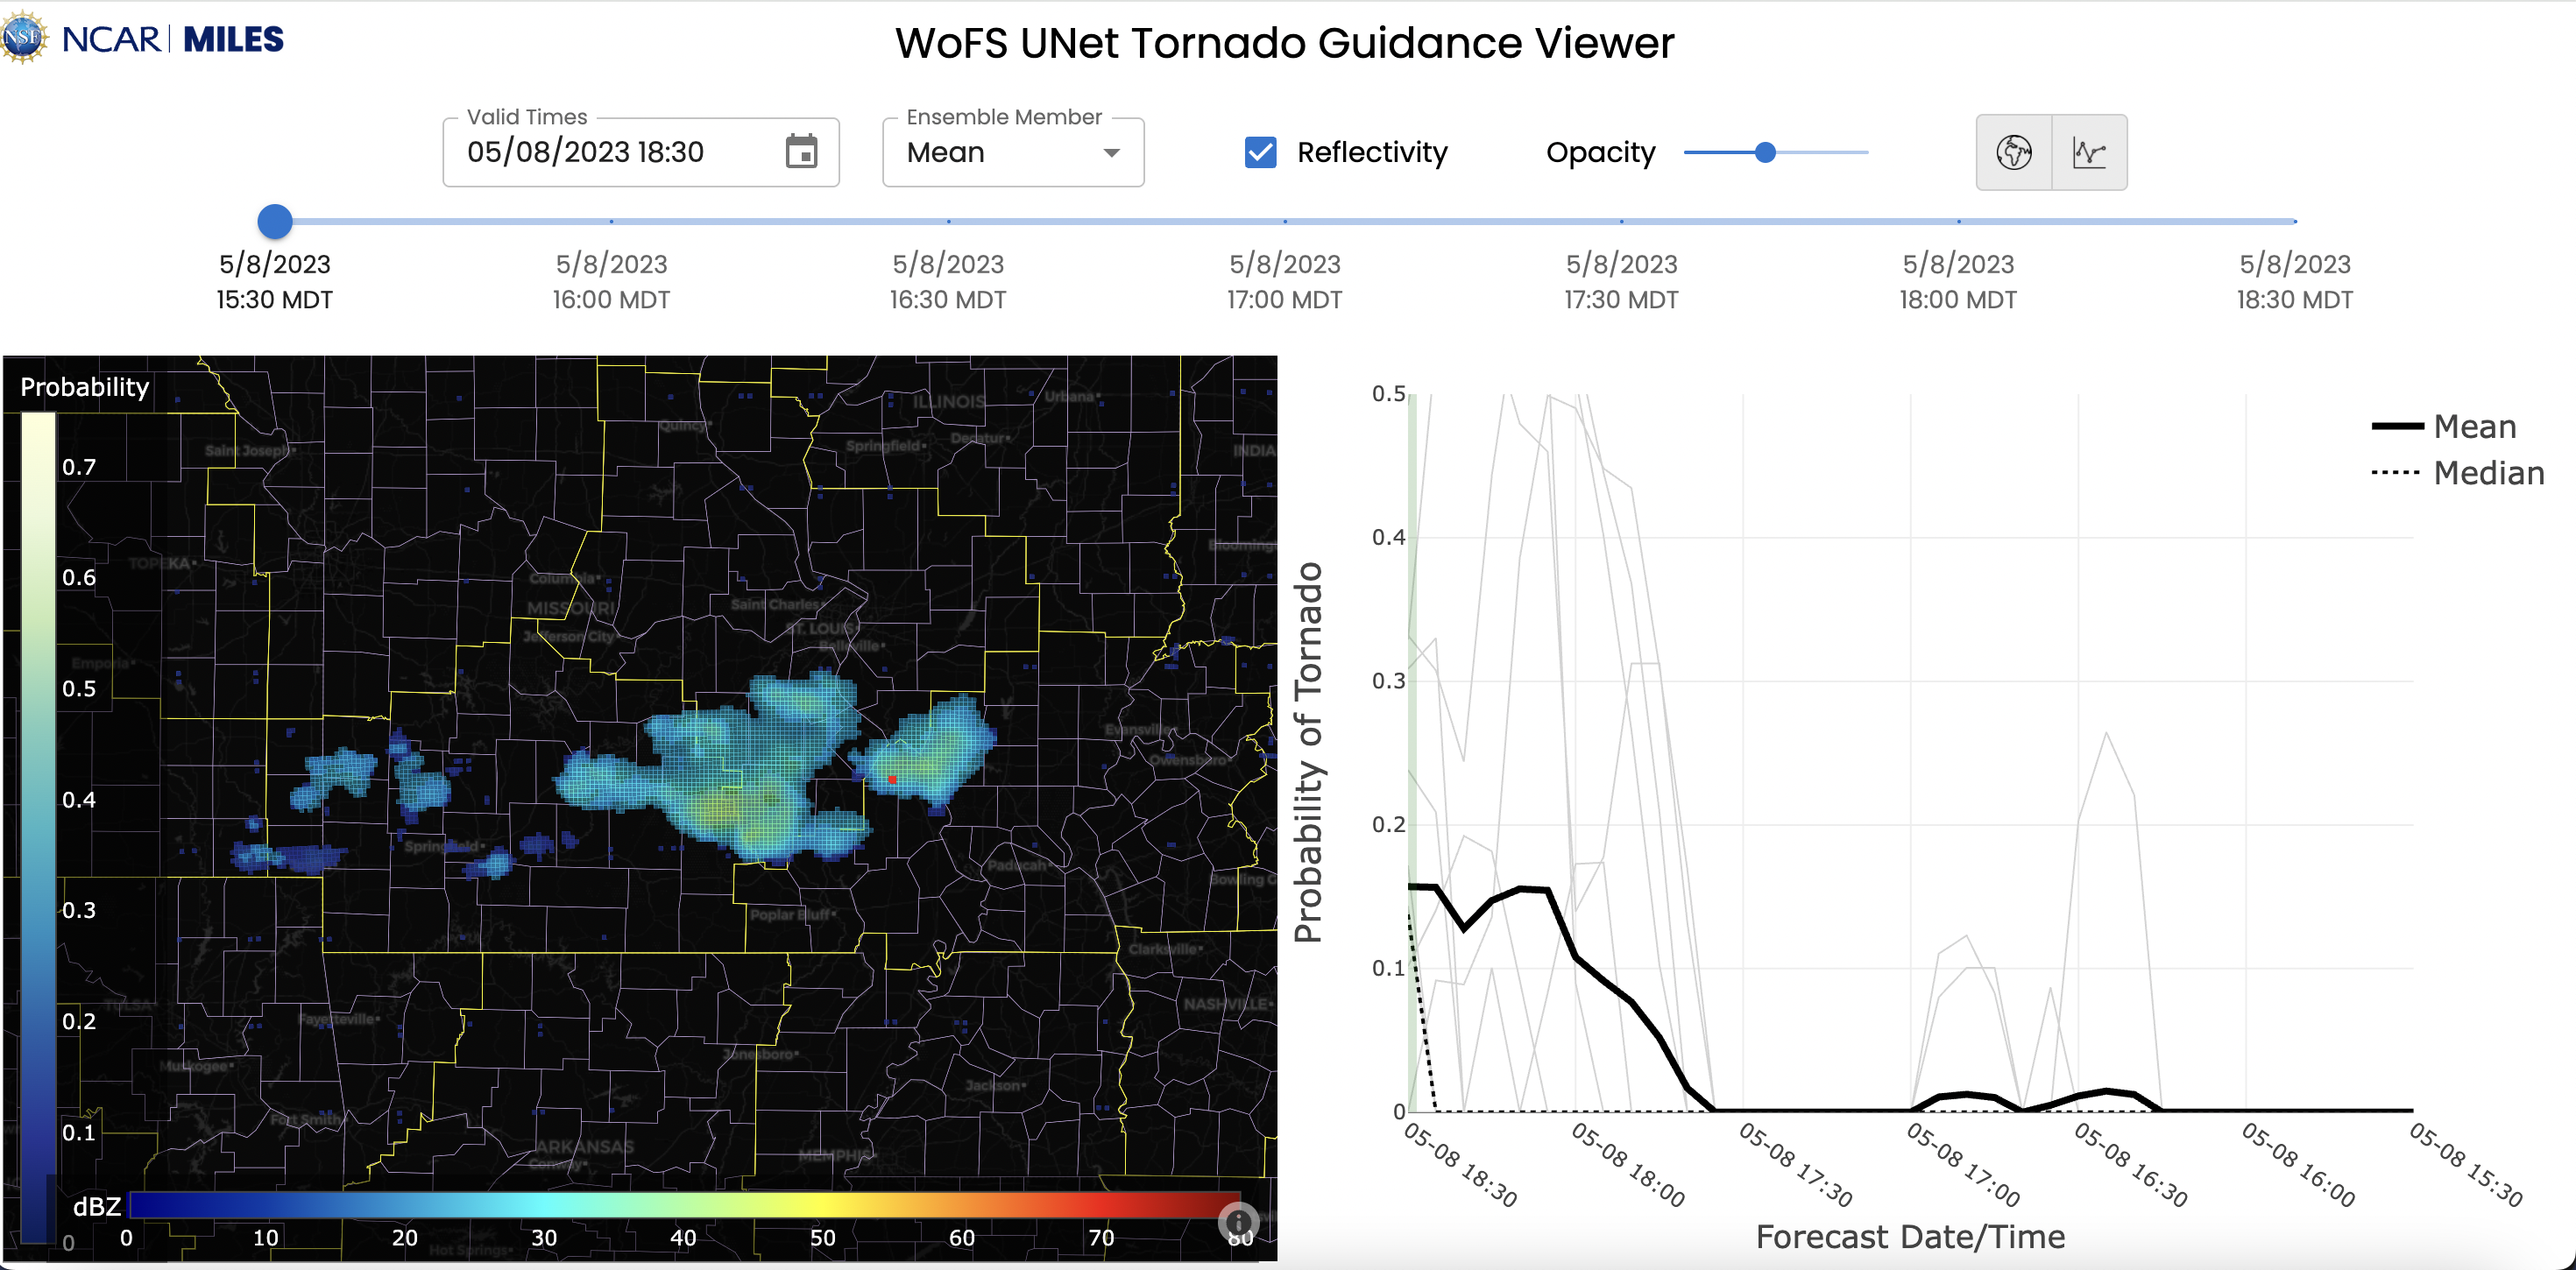
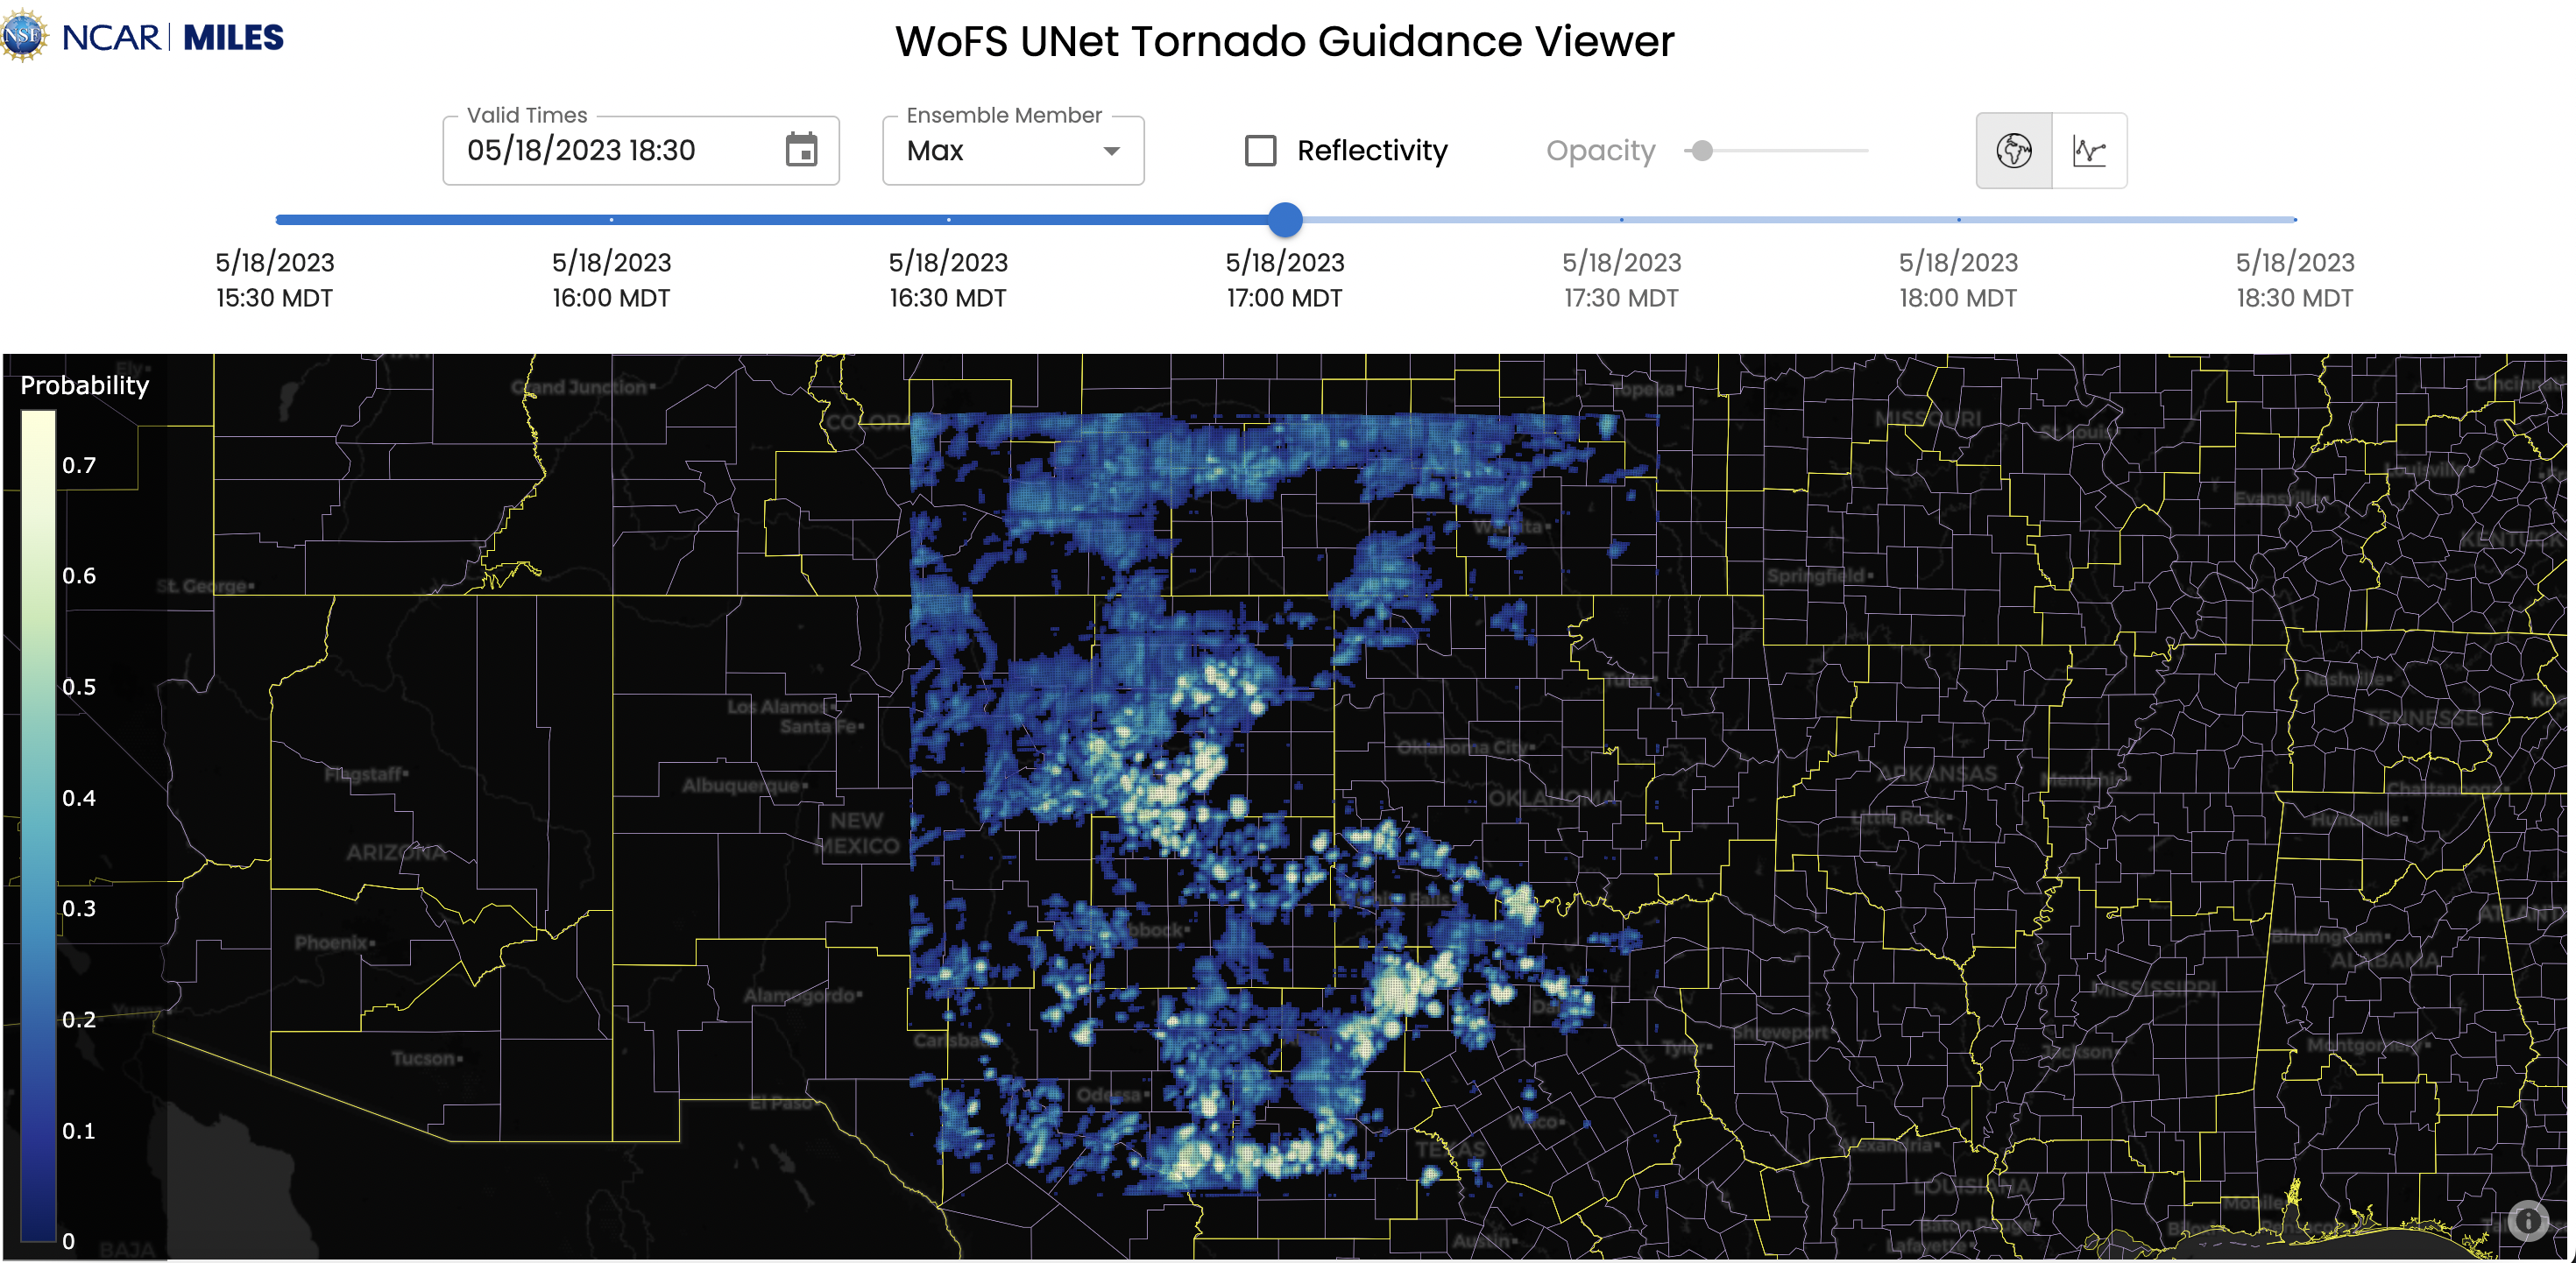
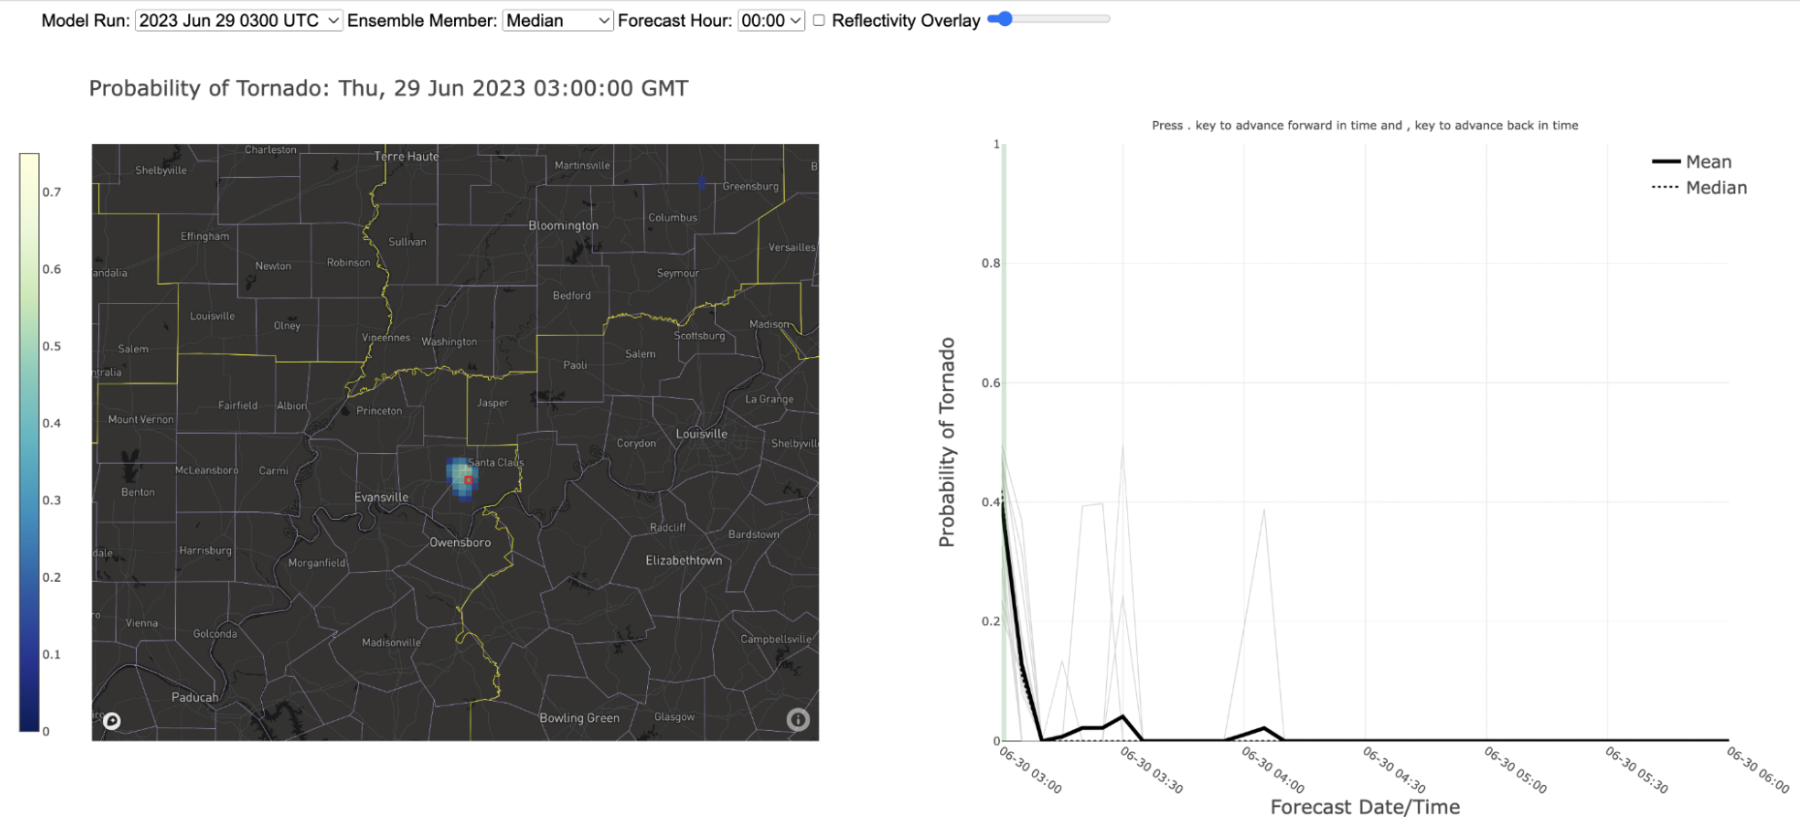
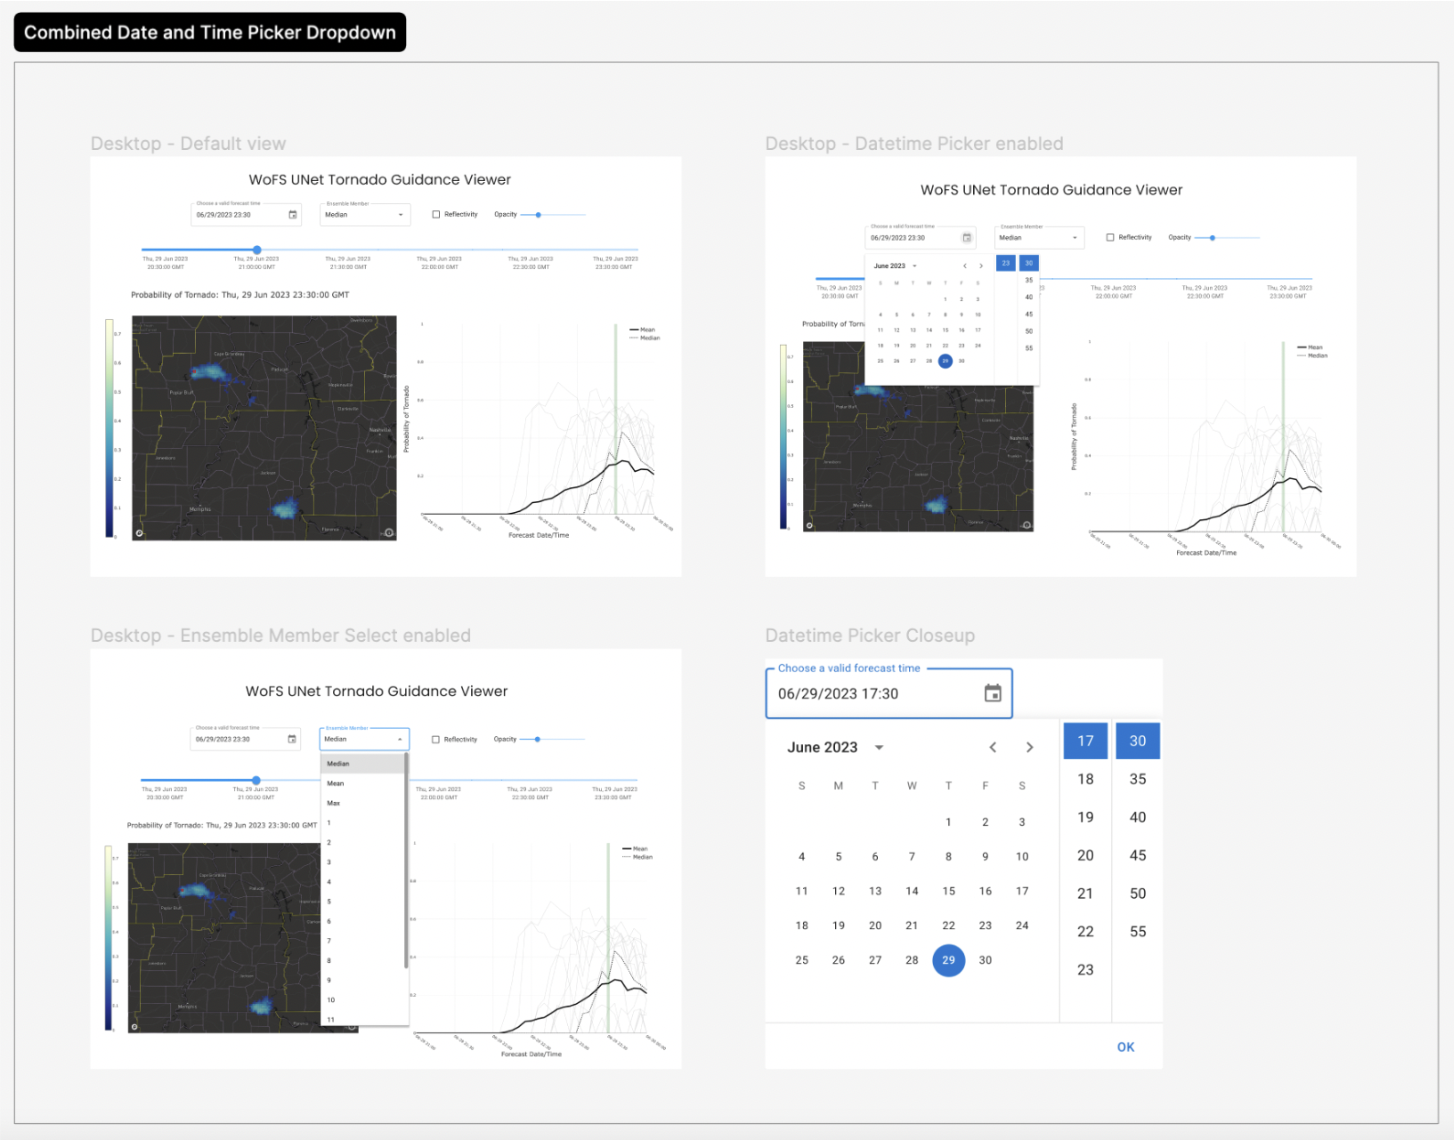
My goal was to redesign and develop an existing web visualization showing machine learning model prediction outputs of tornadoes on a map (see below). This original version required users to choose a model run time from a dropdown menu and then a forecast hour from second dropdown menu. I was tasked with creating a new version that would allow meteorologists to select one fixed valid time and see how models for this valid time changed as they were initialized at different times.
To begin the redesign process, I held workshops with meteorologists where we discussed some of the other tools that they use to visualize model outputs. Looking at examples such as Pivotal Weather, I identified key user interface features such as a slider that allows users to smoothly compare geospatial output over time.
After these workshops, I produced interactive mockups in Figma and sent them to scientists for feedback and iteration until we felt that the prototypes were ready for development.
This visualization presented some interesting technical challenges since the model datasets consisted of Messagepack files stored in an Azure cloud storage bucket, indexed by their init time and forecast hour. In plain English, this meant that the datasets were all stored in small separate parts, and their file names didn't include the valid time that they were predicting for. As a result, I had to write several custom JavaScript functions that would take in a valid time and generate a list of all the files that were needed to create the visualization requested by the user.
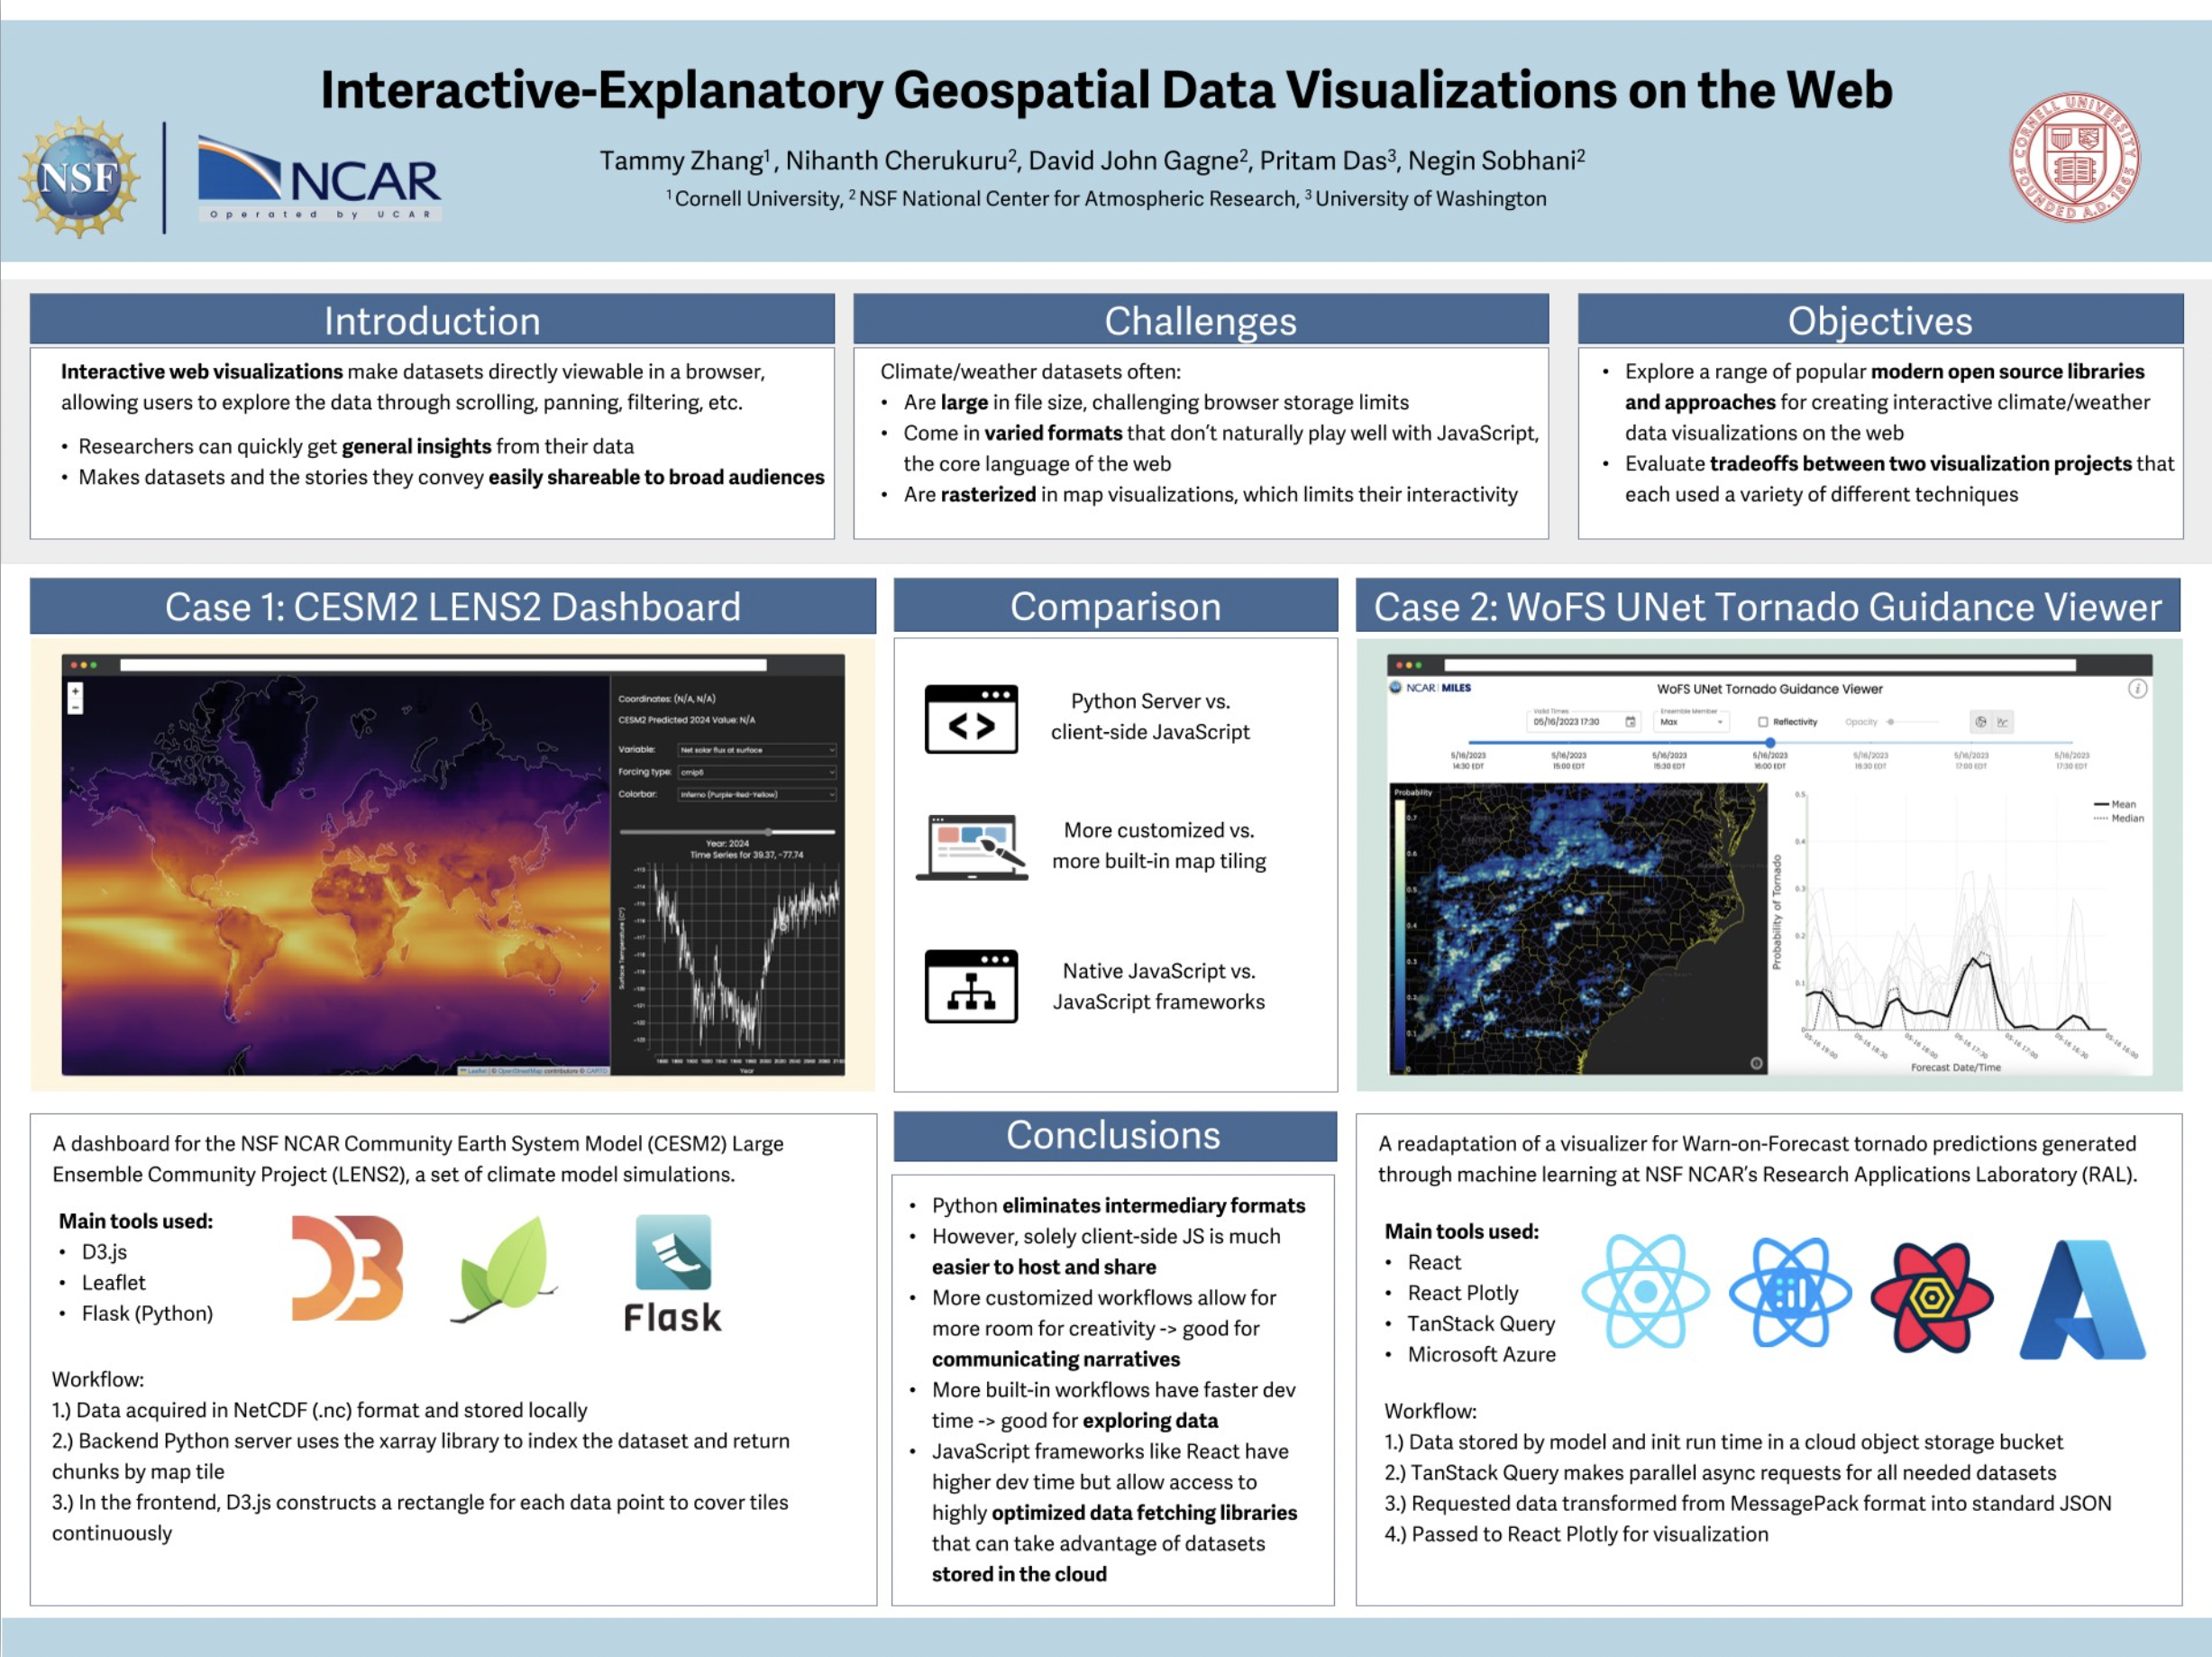
I later presented a poster at the American Meteorological Society's Annual Meeting and Student Conference in February 2024 comparing this project to another case study I completed while working at NSF NCAR.