CESM2 LENS2 Dashboard
Visualizing gigabytes of climate model outputs in a full-stack web app
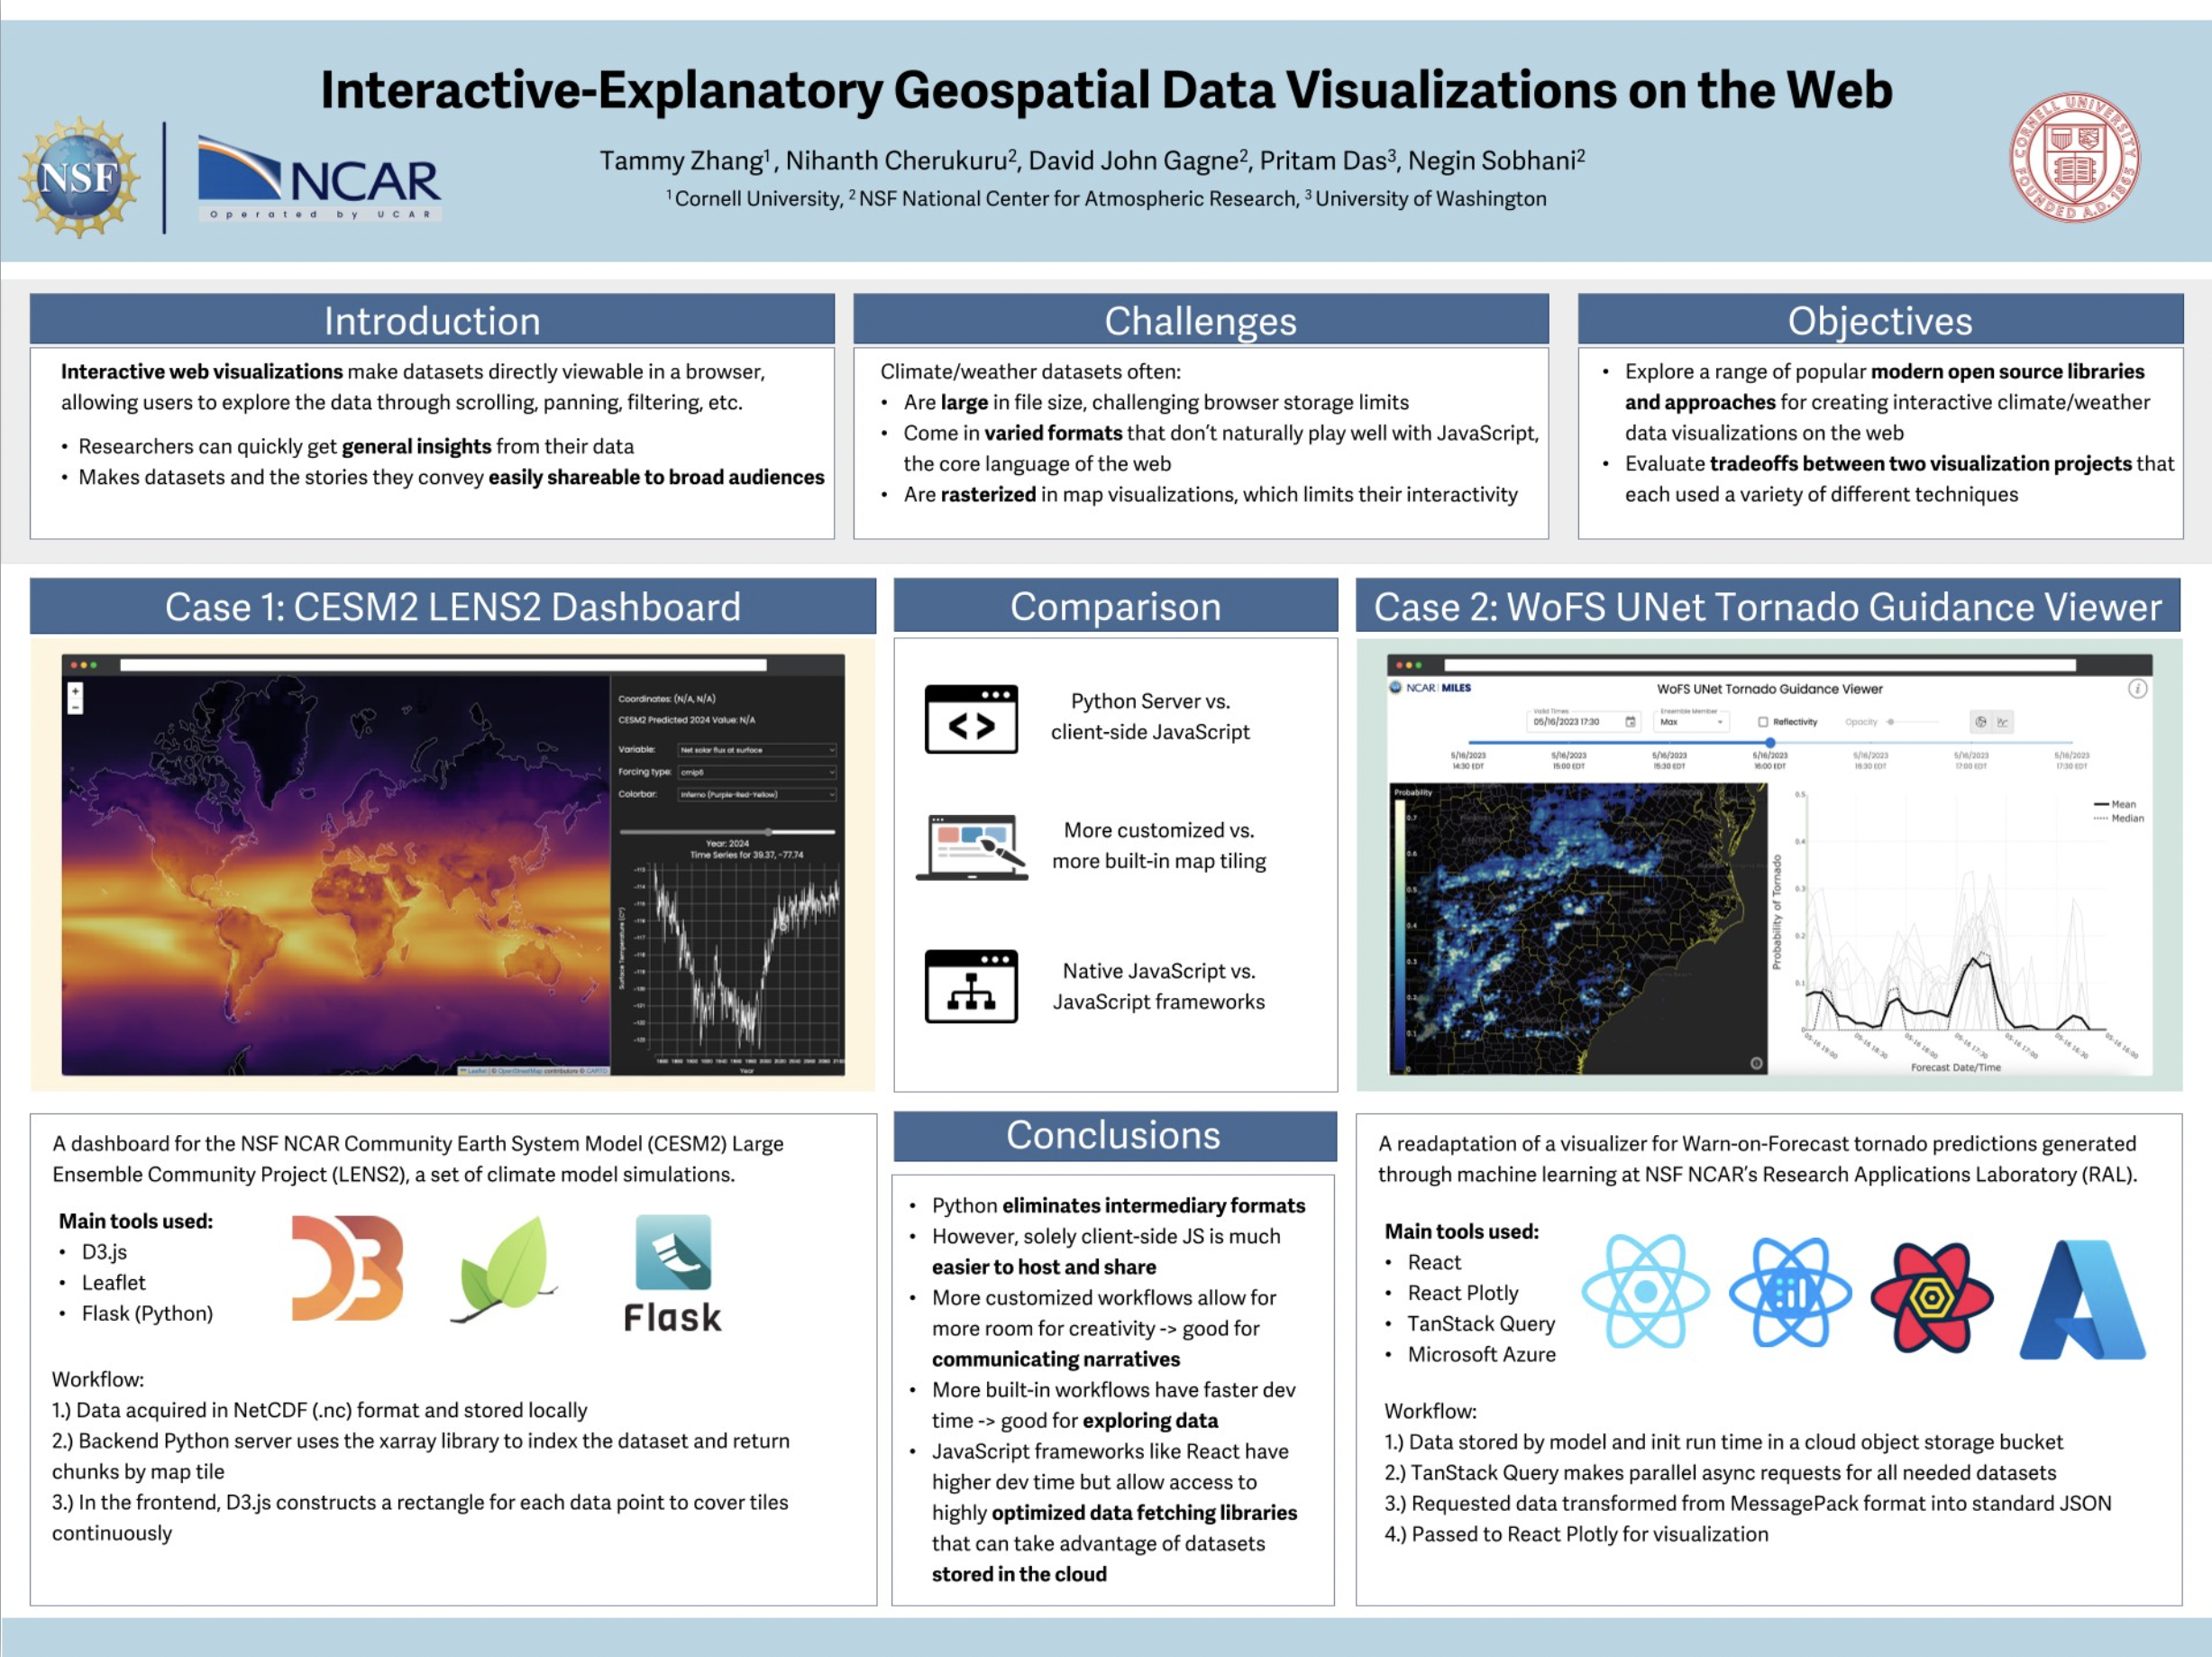
Developed during Summer 2023 while working at the NSF National Center for Atmospheric Research, this project aimed to visualize datasets produced by Community Earth System Model 2 Large Ensemble (CESM2 LENS2).
CESM2 LENS2 is a climate modeling project that aims to simulate climate variability and change under different scenarios; outputs are generated in a one degree spatial resolution covering the period 1850-2100 over the entire globe.
Climate models like this one generate overwhelming amounts of data. After selecting 8 variables of interest from a total of 2,300 possible options, the raw files were still almost 2 gigabytes in size.
The challenge for this project was to see if there were ways to feasibly visualize these files in their original NetCDF format directly in the browser.
NetCDF is a standard format for a lot of atmospheric data since it nicely describes multidimensional variables, such as points that have a longitude, latitude, and time associated with them.
A major challenge of interactive visualization with this file type is that it doesn't naturally play well with JavaScript, the core language of the web. While it is possible to use a Python script to convert NetCDFs to the more web-friendly GeoJSON, something I've done for other projects like Hurricanes, the sheer size of the files in this use case made this preprocessing impractical.
However, even though NetCDFs are difficult to handle with JavaScript, they're great to work with in Python - especially when we're able to use libraries specialized for handling multidimensional data like pandas, NumPy, and Xarray.
As a result, I was tasked with seeing if it would be possible to build a full-stack web application with a Python backend that could directly help render NetCDF files on the fly.
I looked into a variety of approaches being used in the web mapping community at the time, and became interested in how many people focused on "chunking" datasets in ways that align naturally with the "tiles" of a map. Interestingly, using this kind of approach can allow us to avoid using raster tiles - which don't lend themselves well to client-side interactivity and also requires storing an intermediary data format.
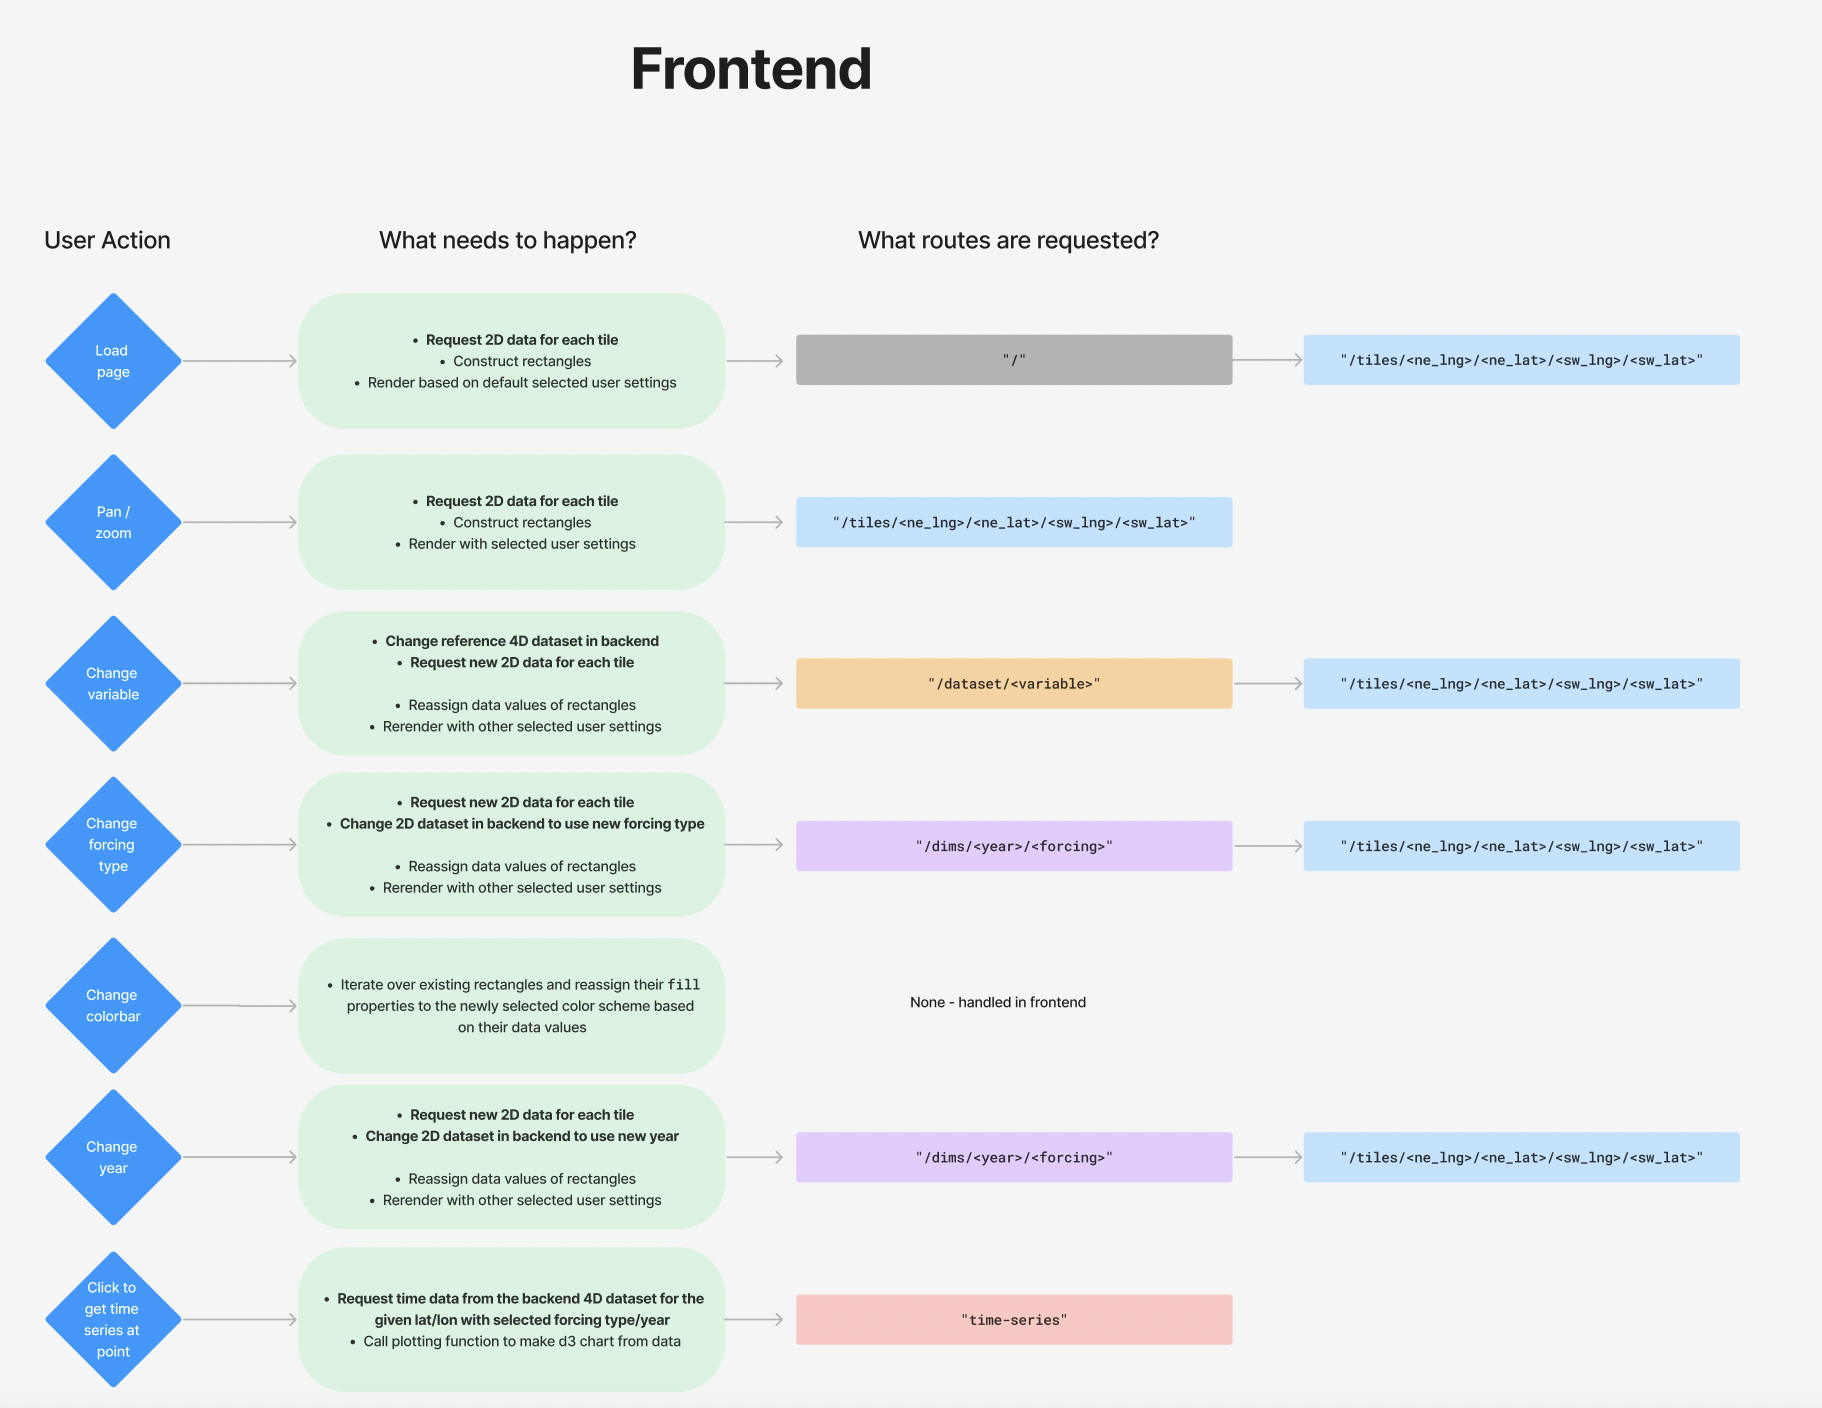
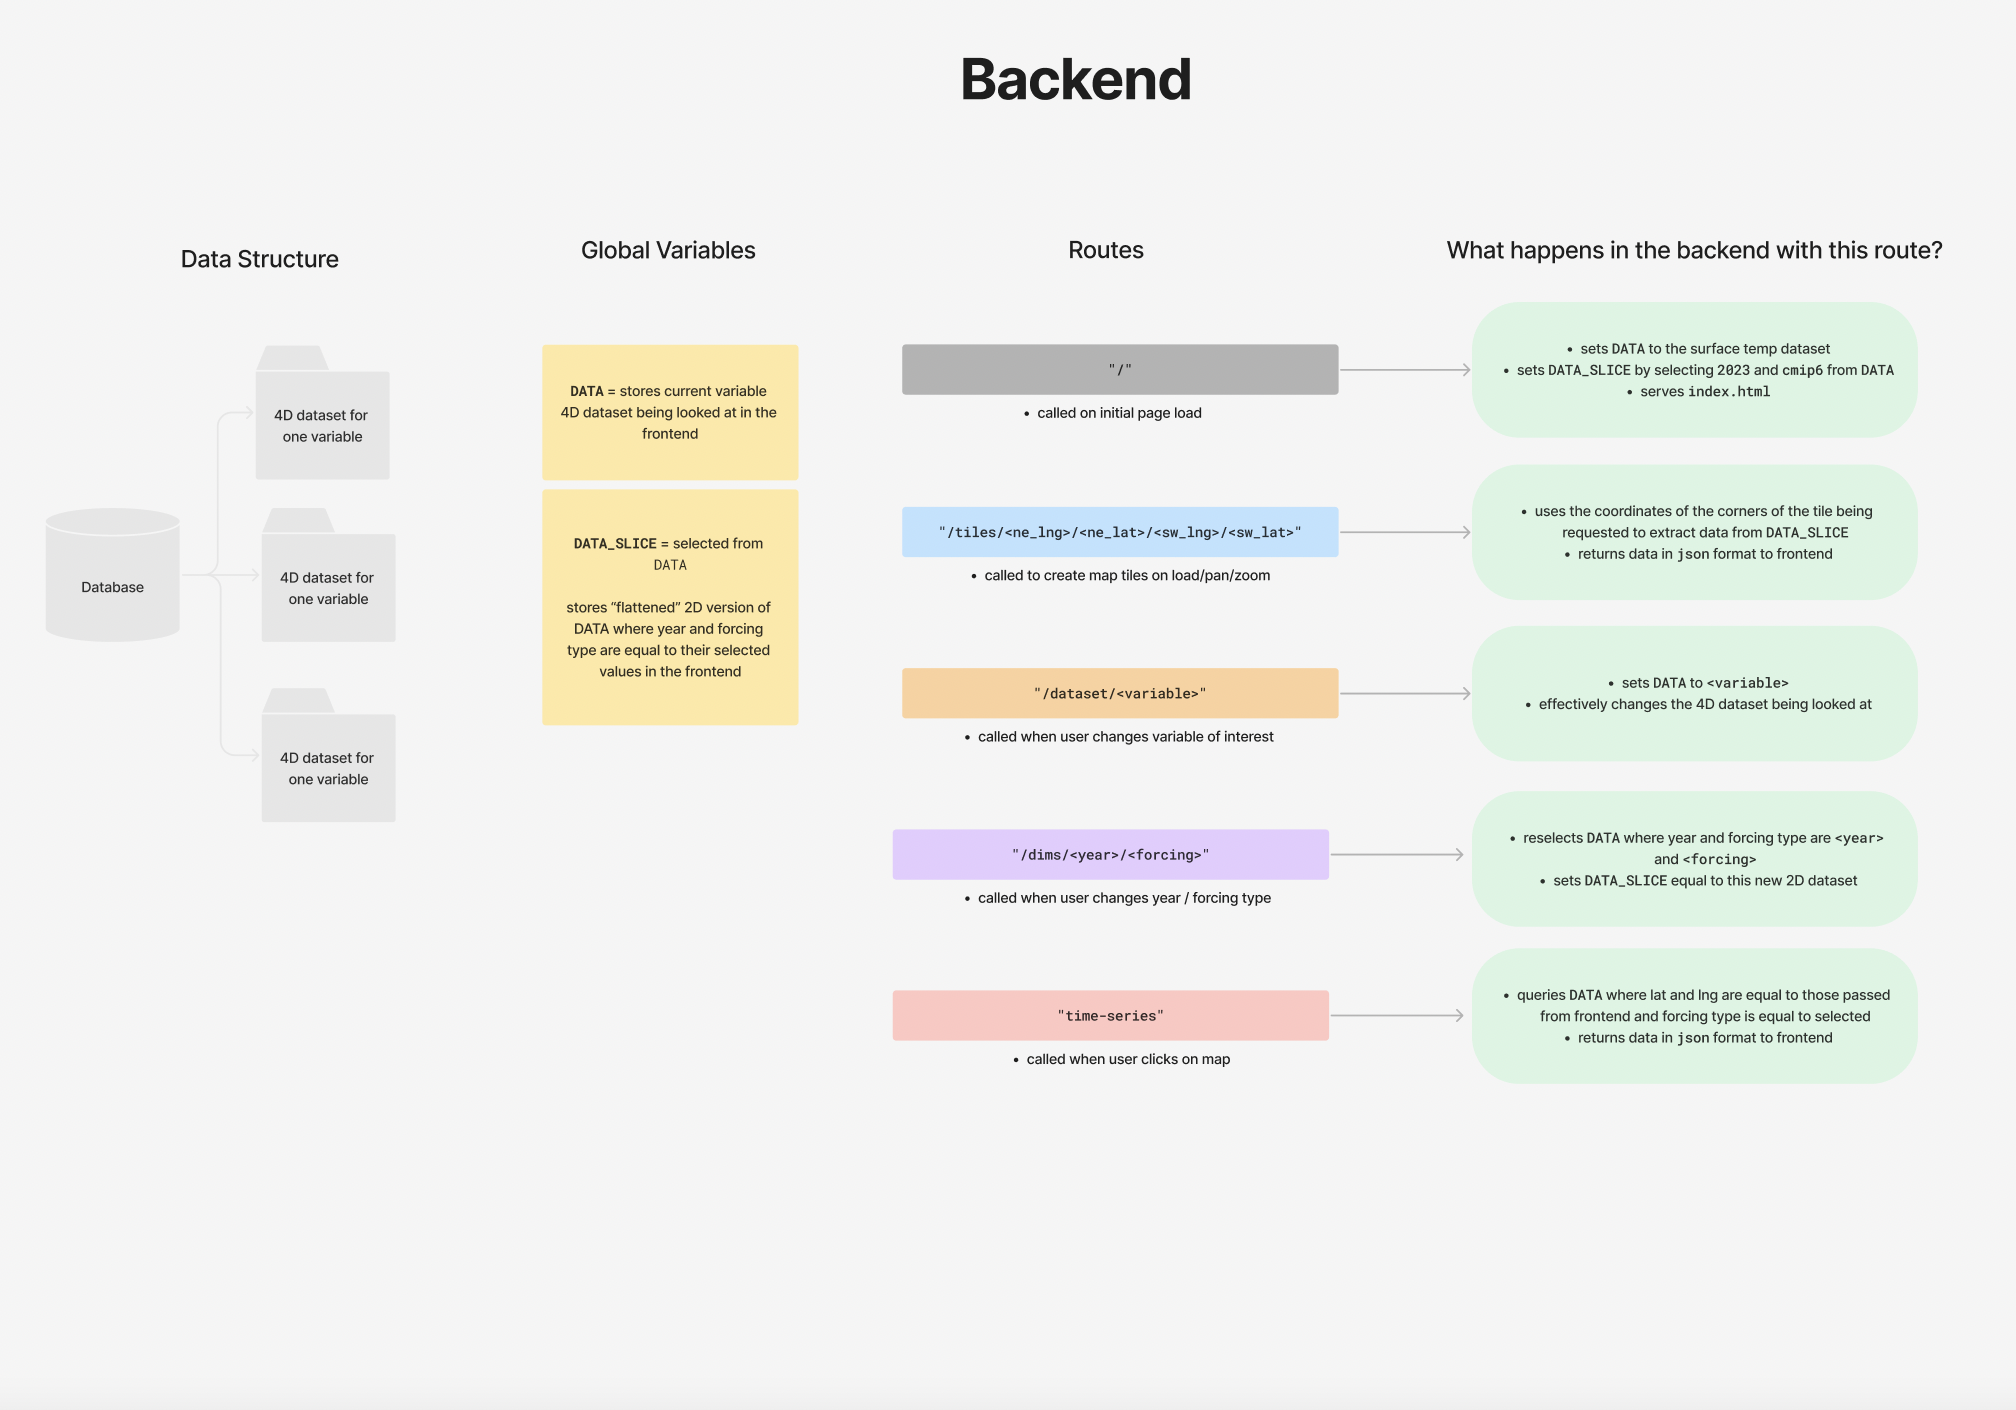
Many experiments and iterative prototypes later, I found that one functioning approach was to use a Python backend that can "slice" up a requested NetCDF file into smaller chunks, each chunk corresponding to a tile in Leaflet's GridLayer method. In this way, each map tile in the frontend makes a request to the backend for the data it needs - once it gets the data, it can use D3.js to construct a continuous grid that dynamically updates as the user interacts with the map. The full breakdown of how each user action is handled in the frontend and backend can be seen in the following schematics.
I first developed a working version using Flask for simplicity, but later collaborated with another student working at NSF NCAR to build a version using FastAPI instead for better scalability. I also presented my research during the course of this project at the American Meteorological Society's Annual Meeting and Student Conference in February 2024, comparing it with another visualization I completed that relied fully on client-side JavaScript.