Global Wind Speed
Scrolling to explore surface wind patterns across the world
While looking at an interactive article from the New York Times on how viral particles spread on the subway, I became curious about how the webpage - which allows users to explore a 3D model by scrolling - was made.
After admittedly doing some digging in Inspect Element and reading some threads on Reddit, I found out that these kinds of visualizations can be made by using JavaScript libraries that turn videos into scrollable elements and then time text boxes with certain frames.
At the time, it was Spring 2023 and I was working as a frontend developer at the NSF National Center for Atmospheric Research. It just so happened that my team, the Visualization Services and Research Group, had a rich catalog of YouTube videos of 3D atmospheric visualizations produced over the years.
As a result, I thought it would be an interesting project to spin up some rapid prototypes to see if we could turn some of our videos into scrollable webpages. I first worked on making a simple version that just focused on getting the video aspect right - once I succeeded, I decided to try a version with text appearing on the screen, the way many long-form journalistic visualizations do it.
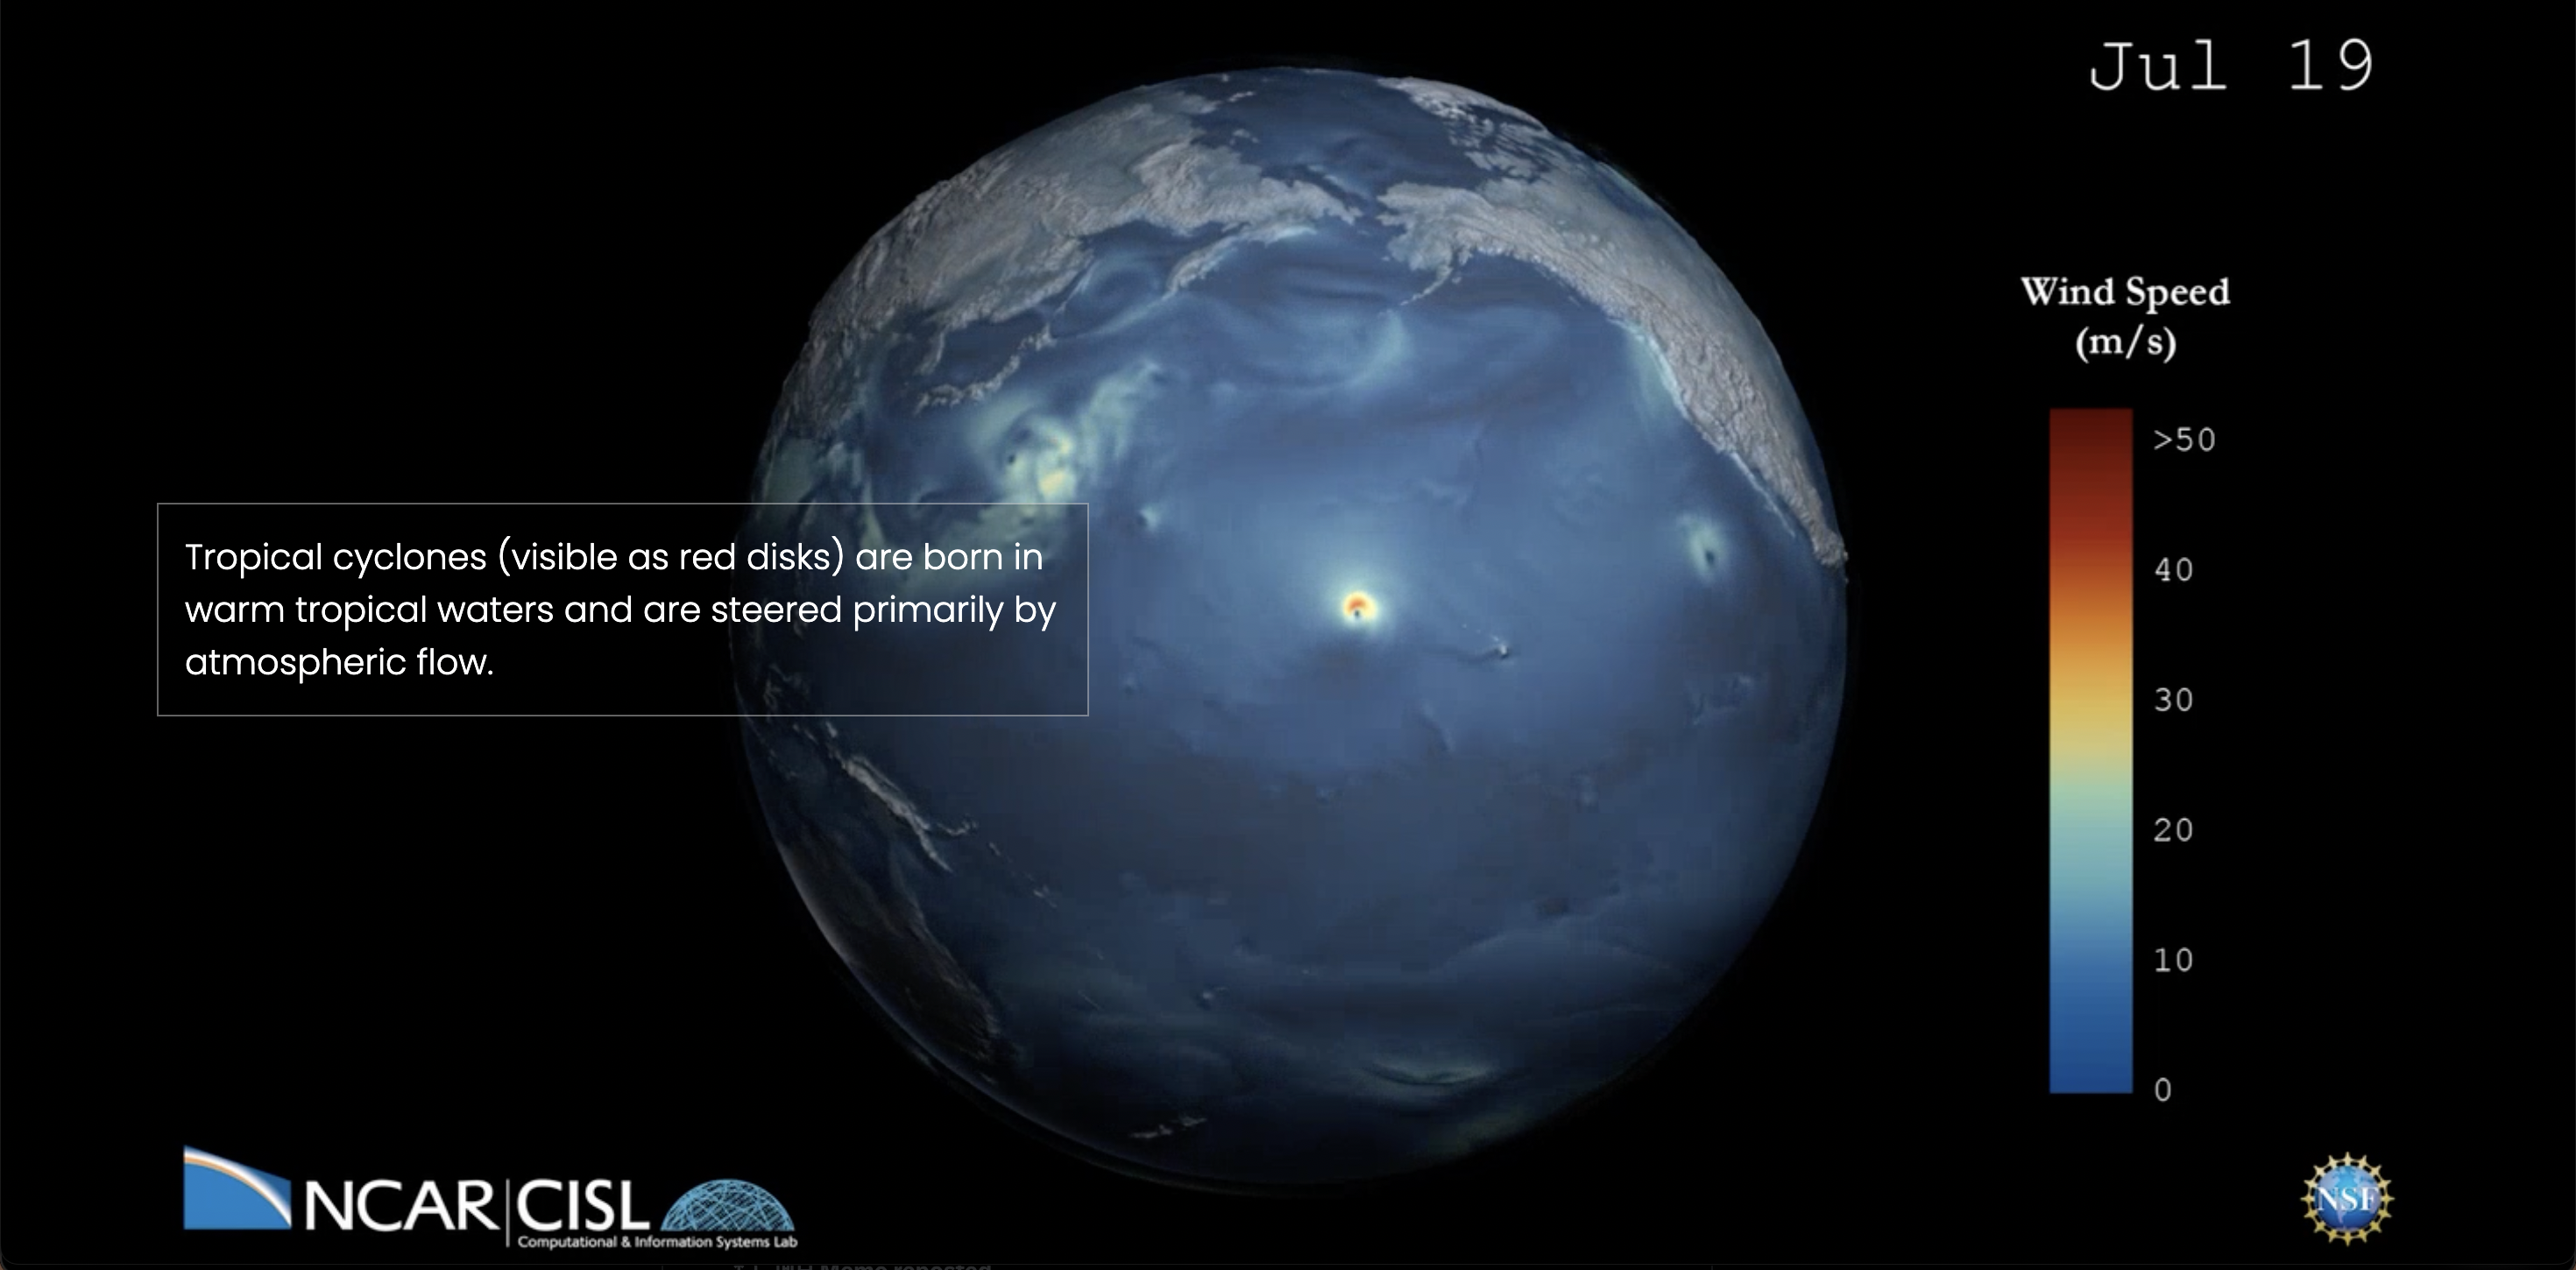
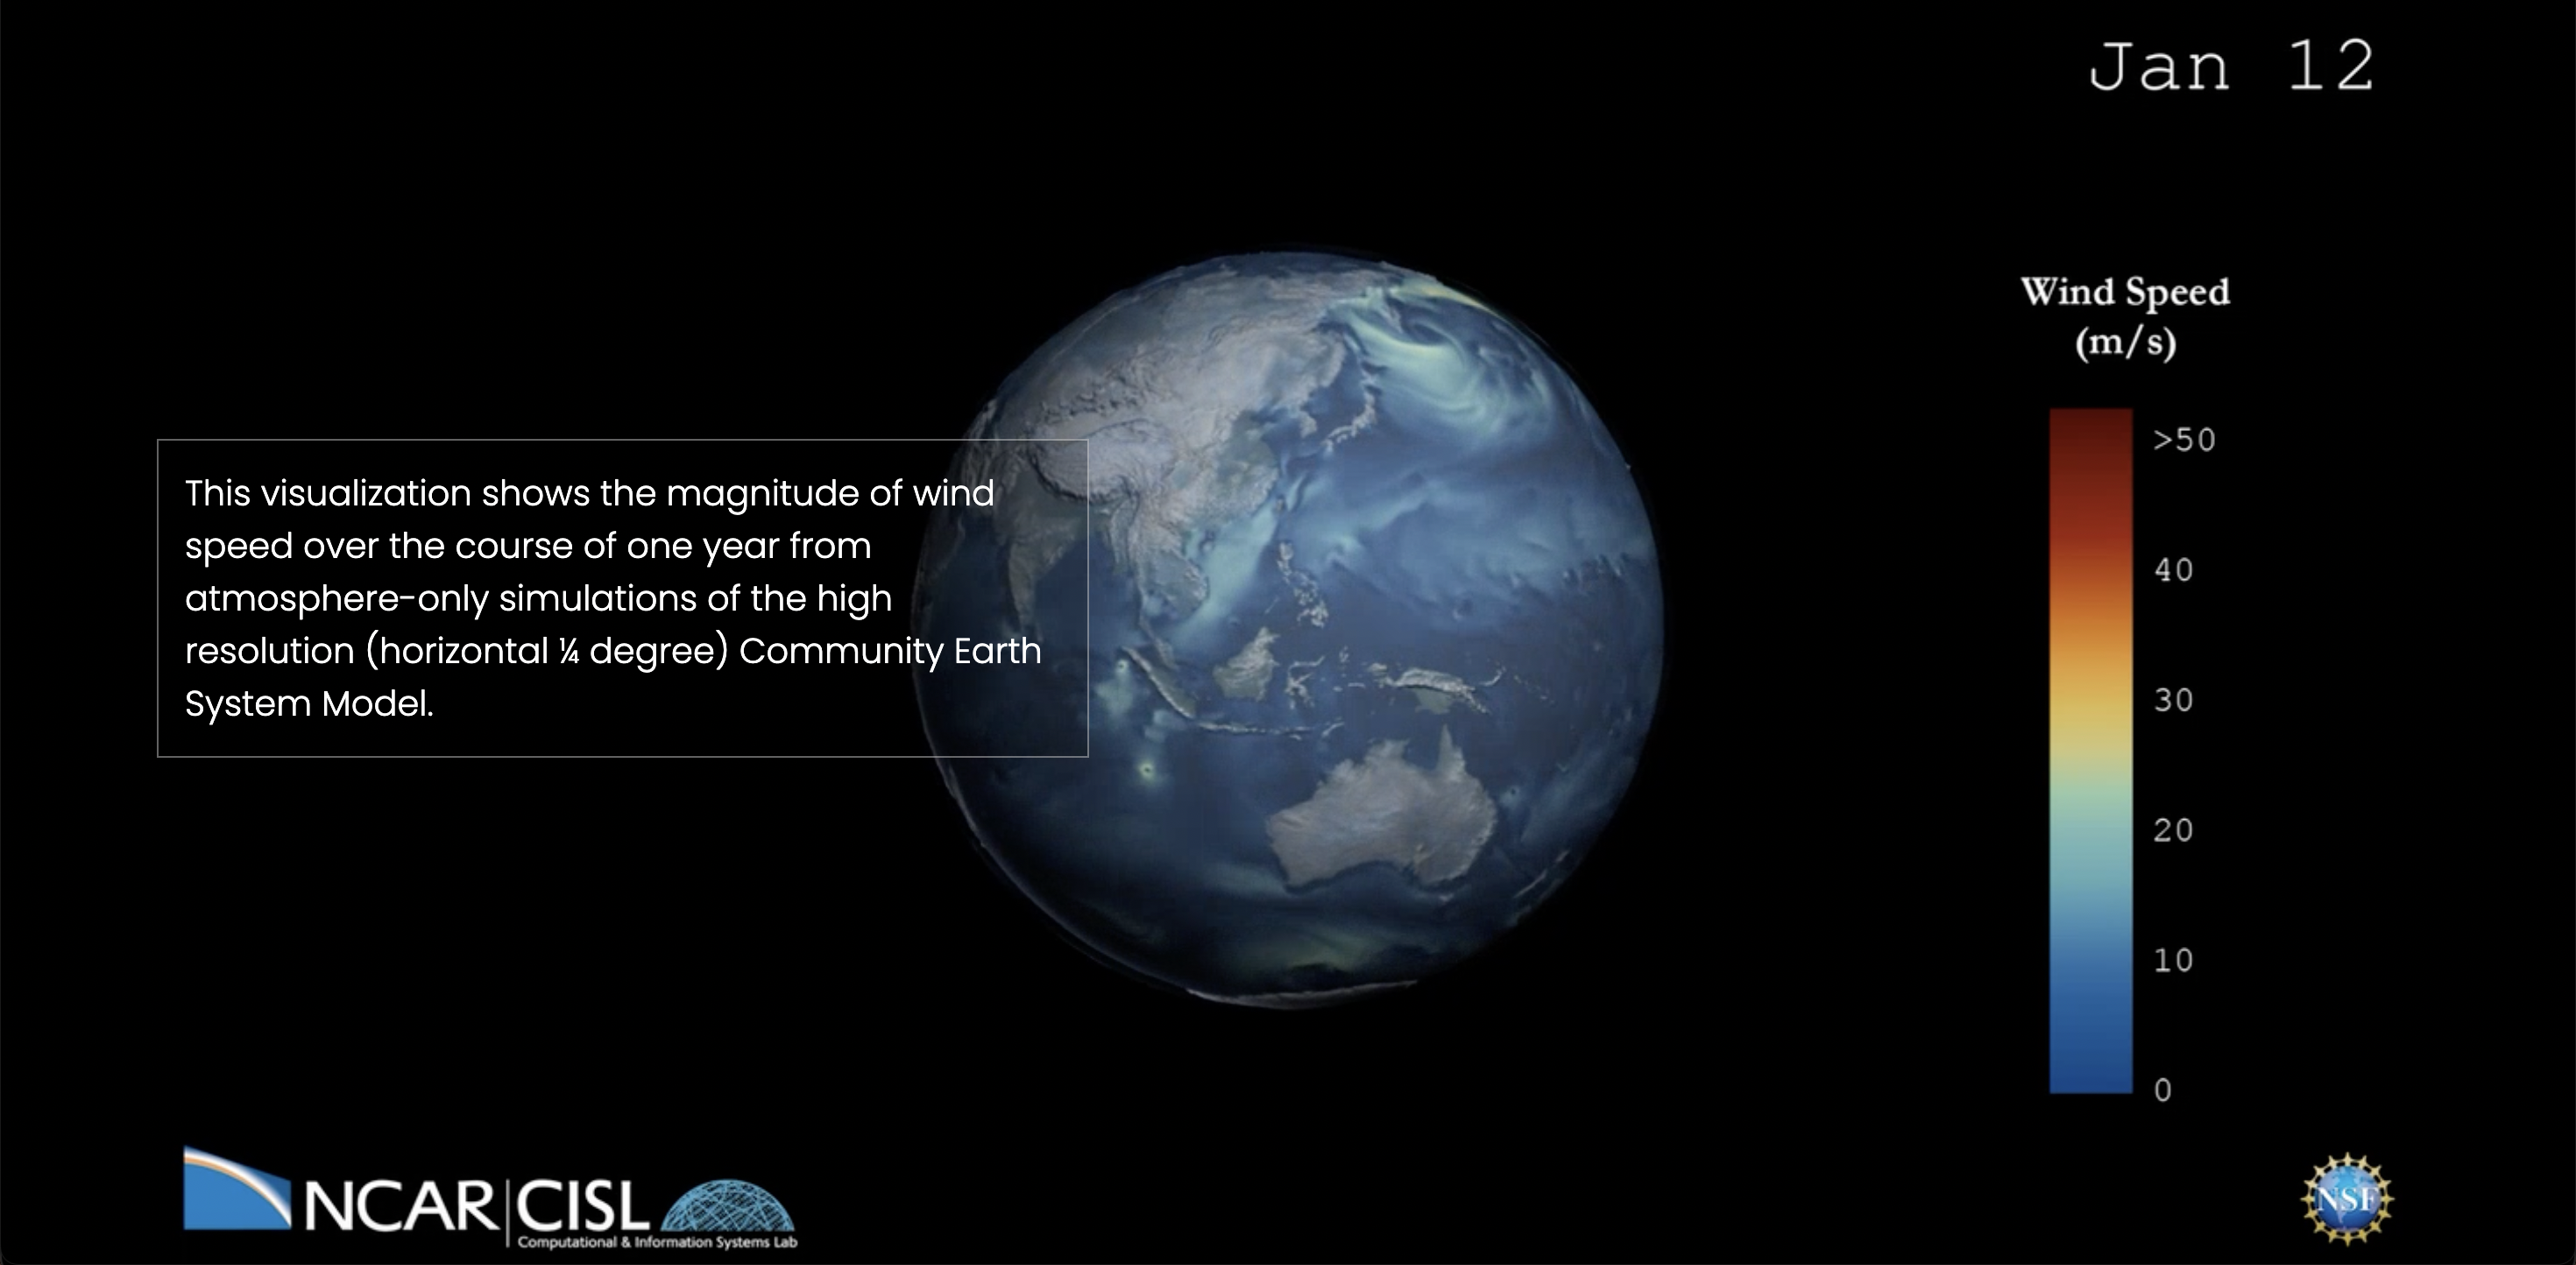
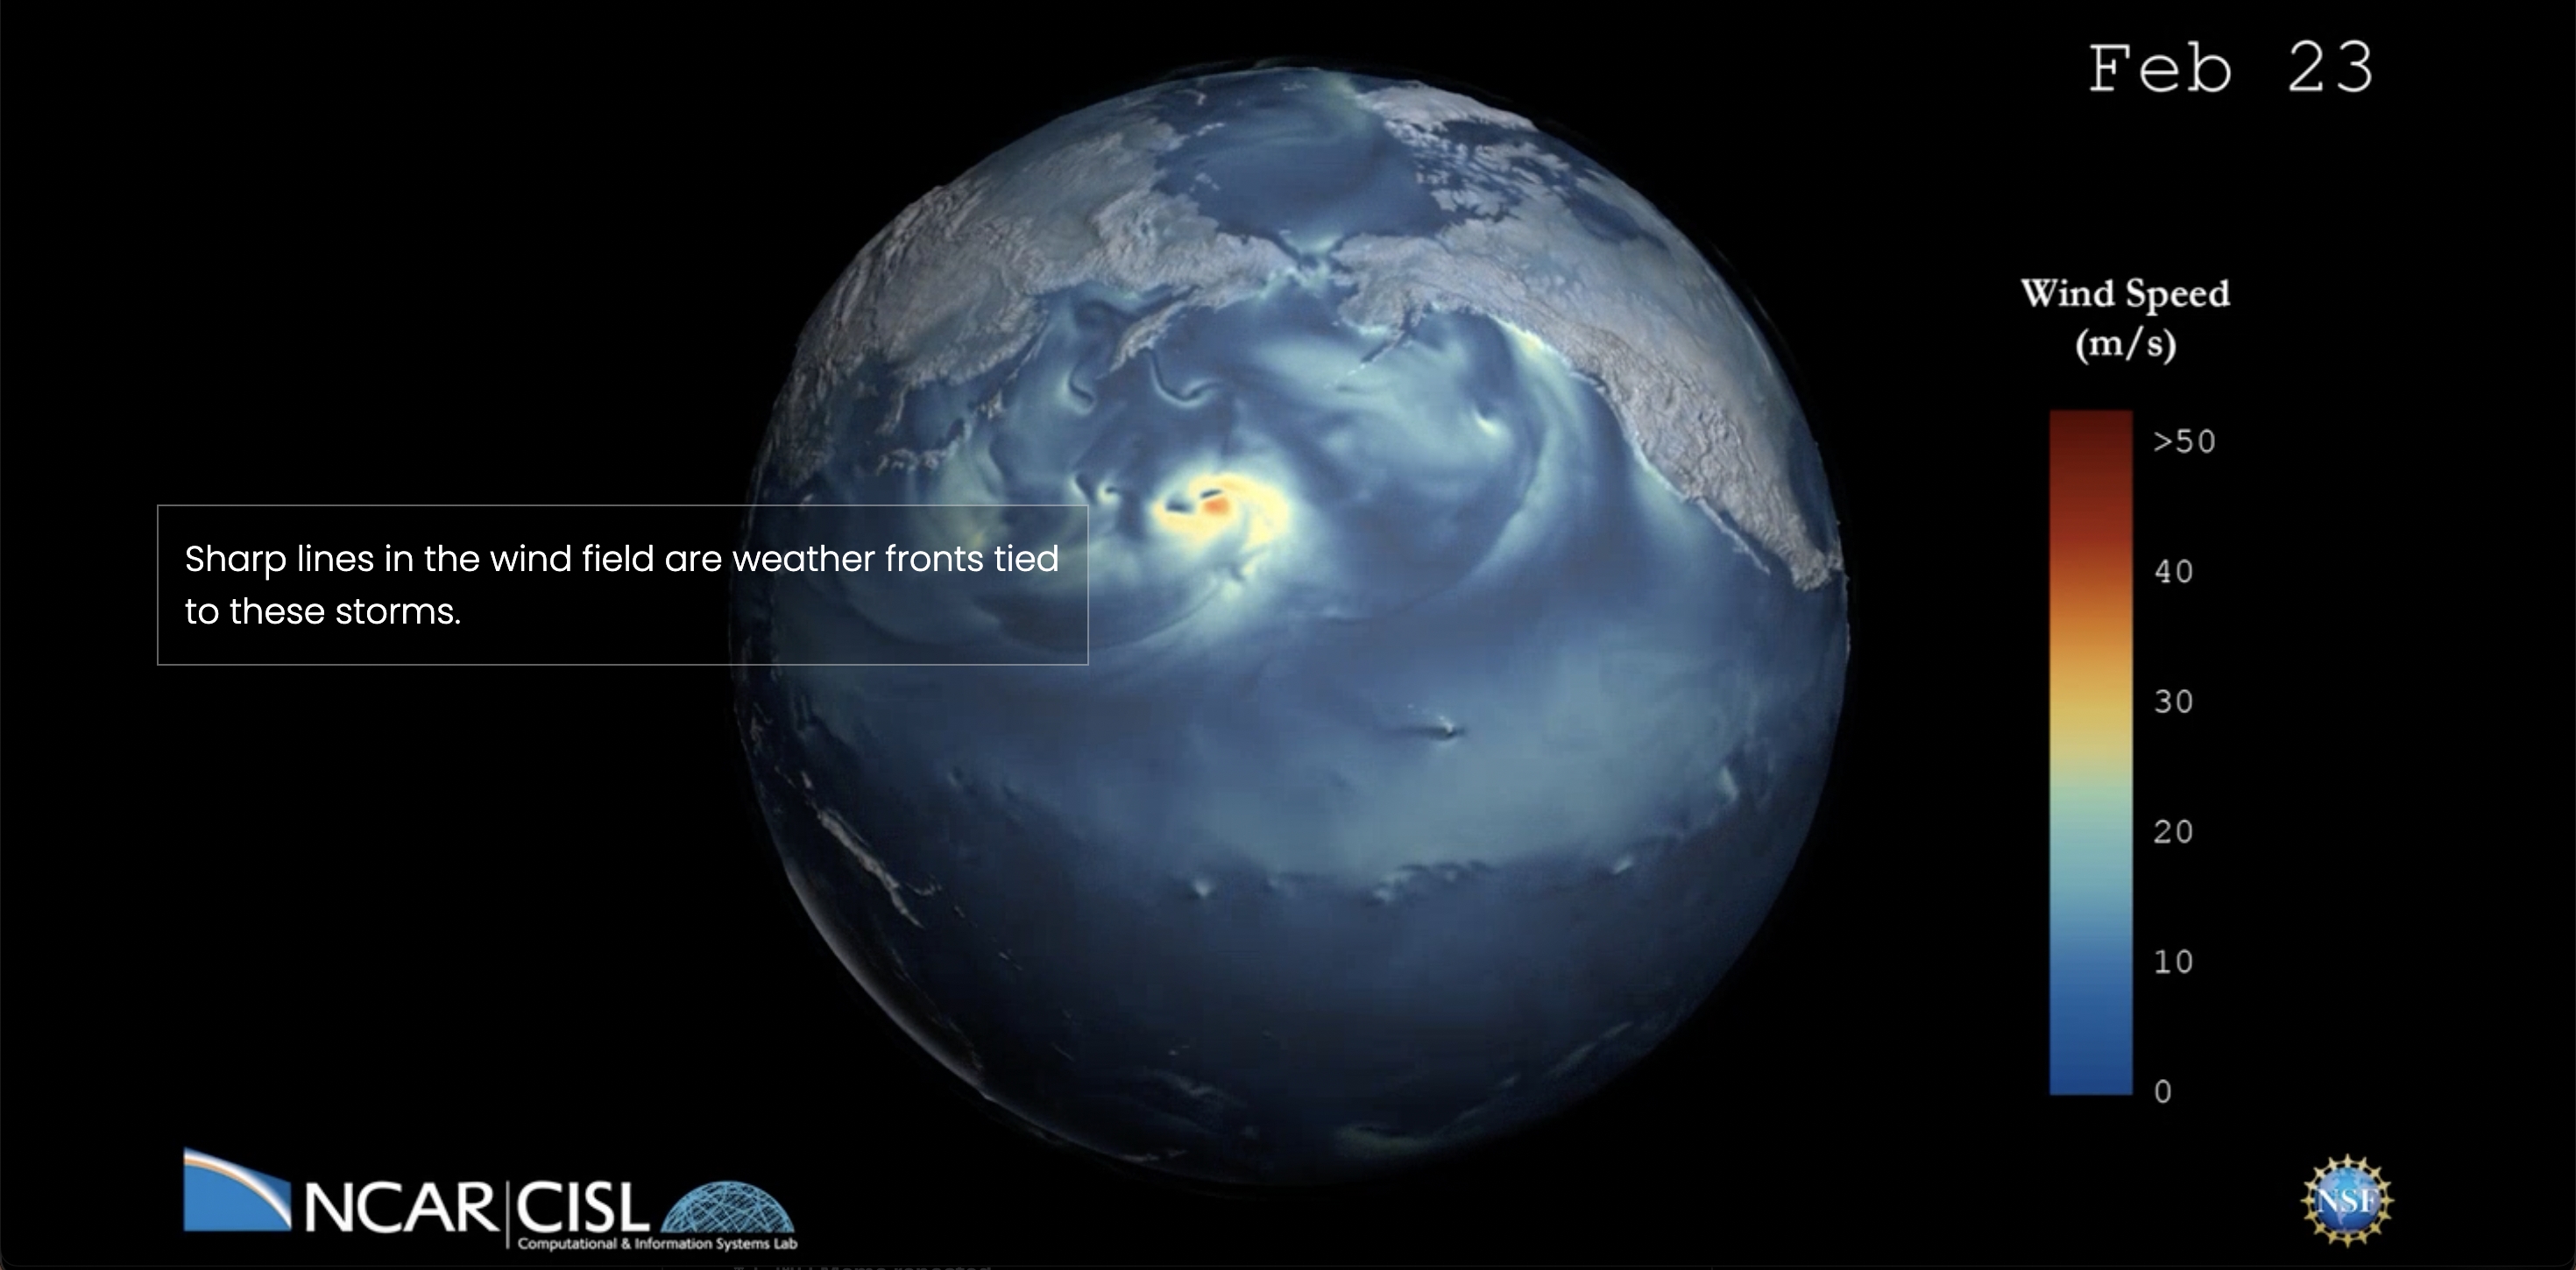
After obtaining a file of one of our atmospheric visualization videos without text, I created a webpage where users can scroll to explore a globe - with timed text boxes appearing at certain points to explain the visualization.
As a rapid prototype, I can think of a lot of ways to improve the design and functionality - such as a shorter video to reduce the amount of scrolling and improved transitions of the text boxes appearing on screen. However, it was exciting to see that this kind of visualization was not as technically difficult as I originally thought. I also enjoyed showing the prototype to my team and having a discussion on how we could use this kind of visualization to explain our lab's work to the public.