San Francisco Trees
Visualizing the planting seasonality of 50,000 trees
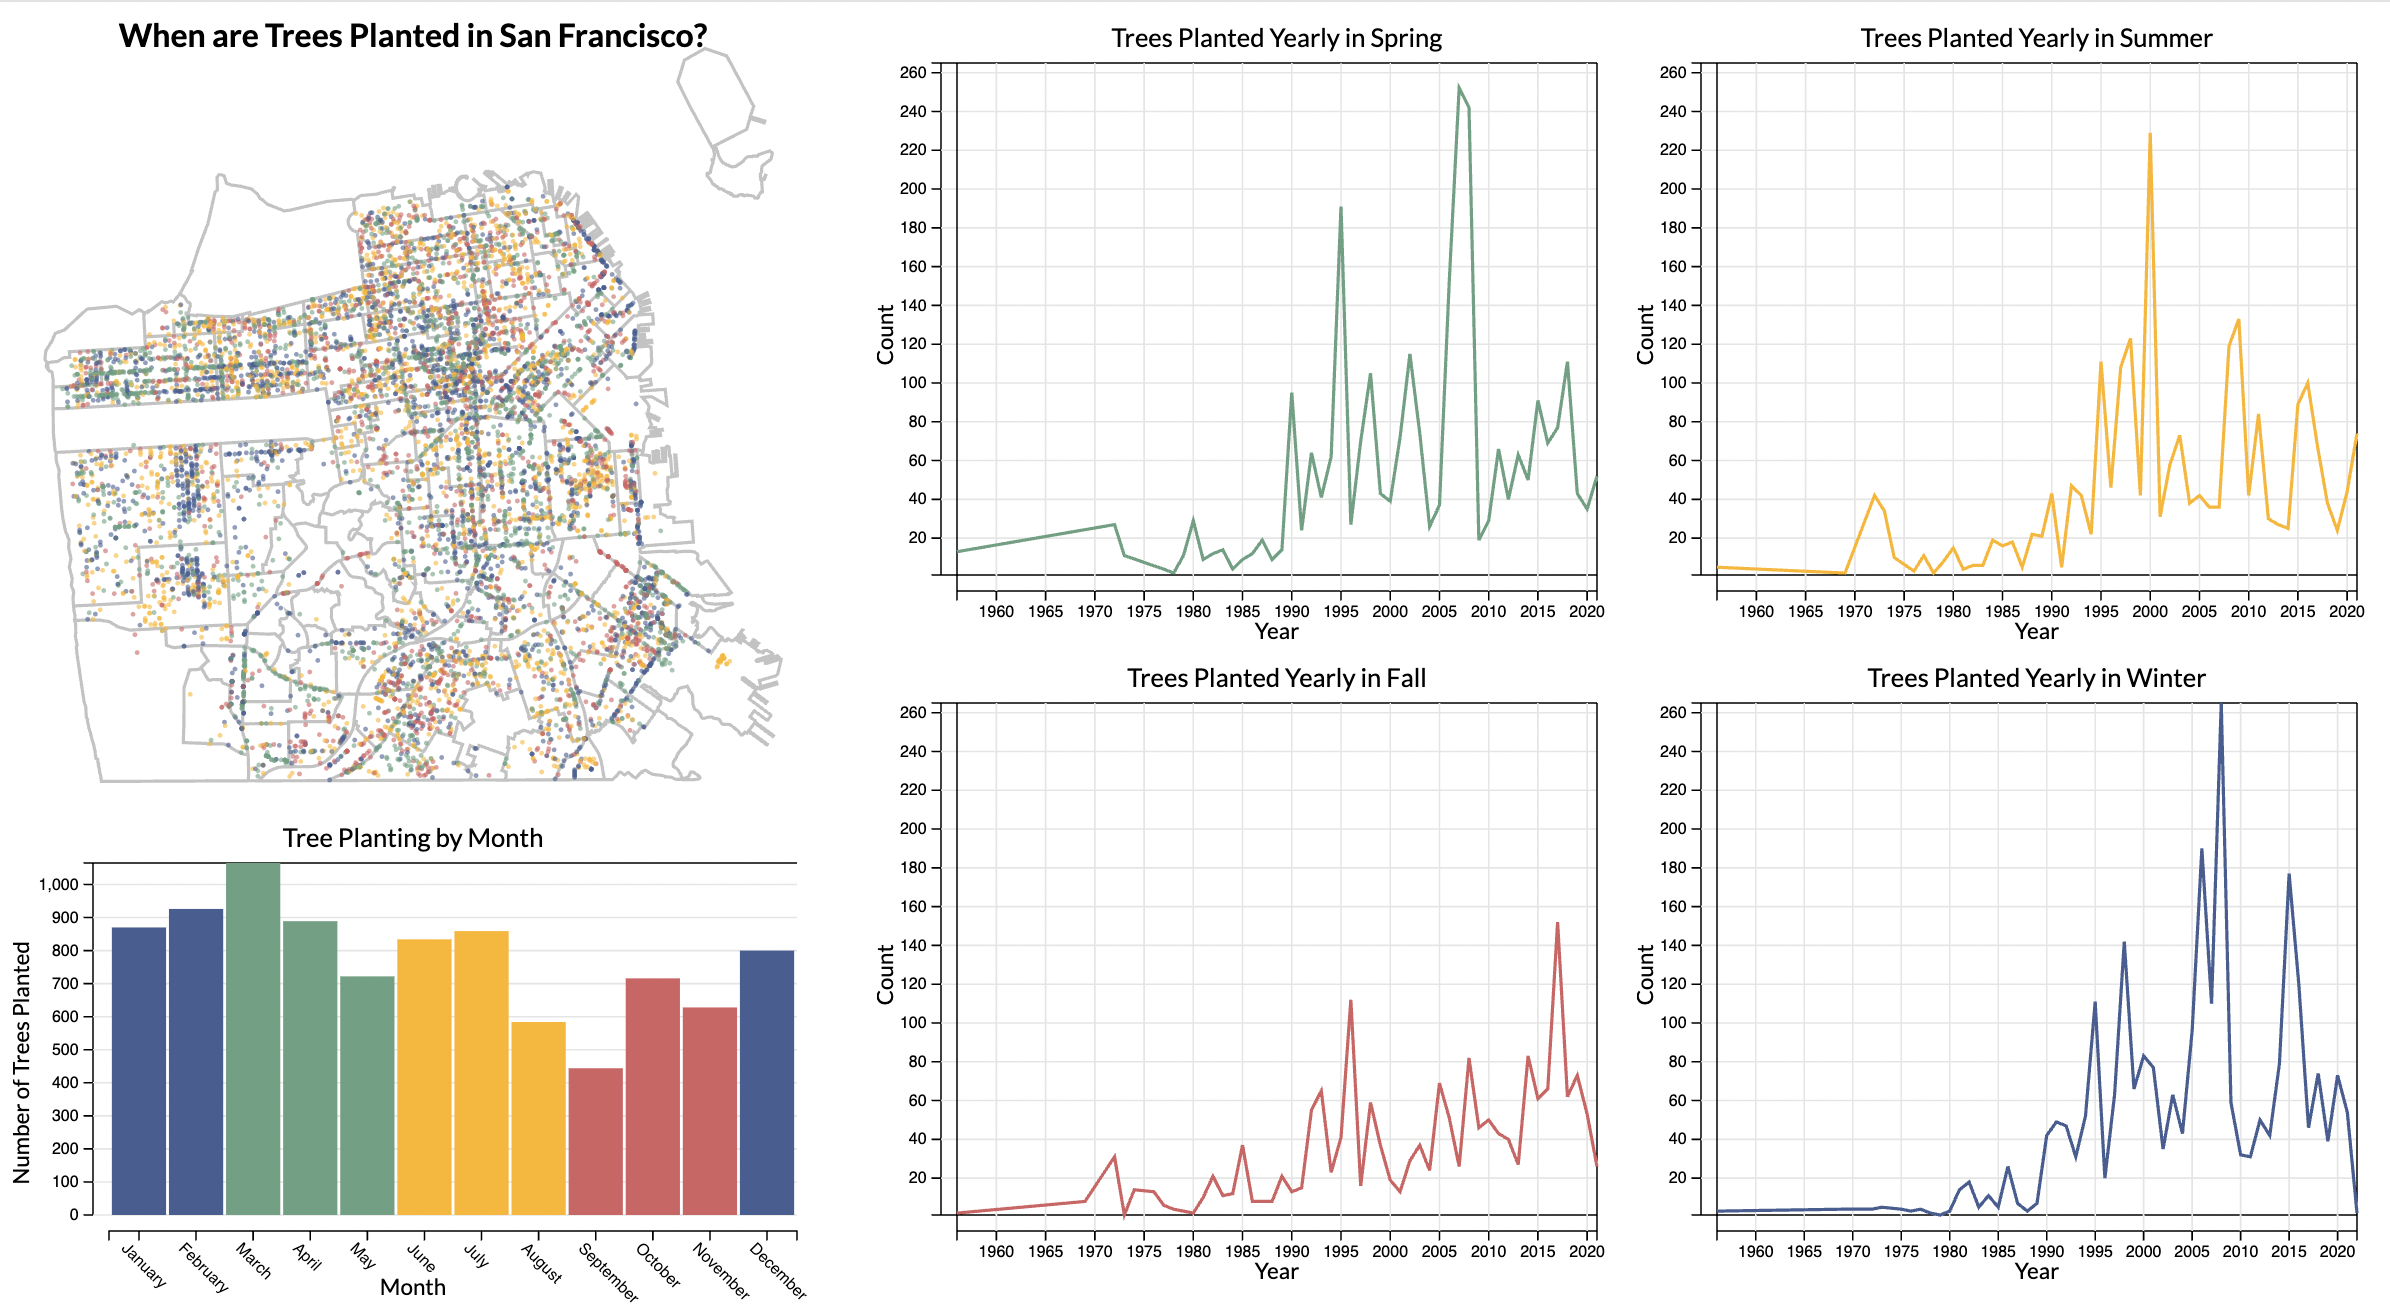
Created as a project for Cornell's INFO 4310: Interactive Information Visualization course in Spring 2024, this webpage uses D3.js to visualize how trees are planted in San Francisco over the course of the seasons.
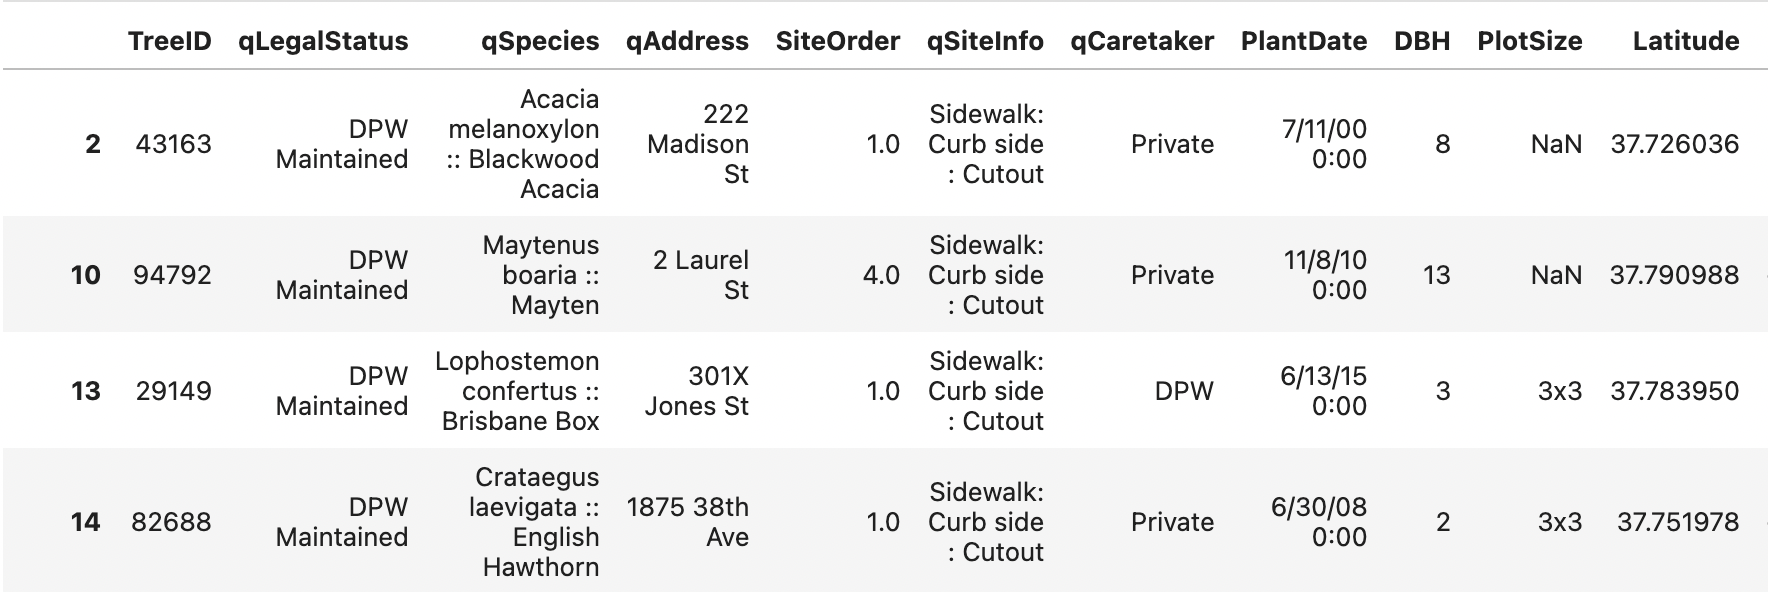
The original dataset was provided by DataSF. The goal of the project was to explore an interesting facet of the data by preprocessing the given files in an unexpected way.
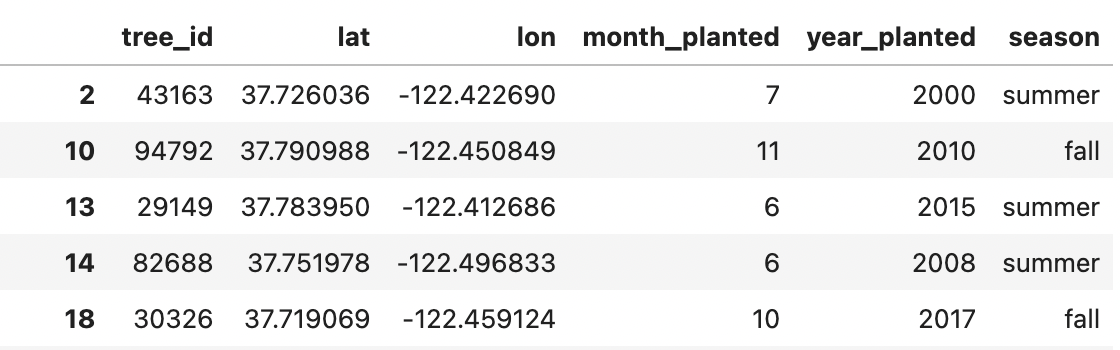
Python was used to clean the data, to extract information on the seasons in which trees were planted, and to restructure the files into the following format for visualization with D3.js in the browser.