Reddit Text Viz
Using NLP to visualize user comments on r/AskReddit
Text is particularly challenging to visualize due to how unstructured and high-dimensional it is - but in today's Internet age, much information, particularly user-generated content, is produced in a text format.
This user-generated content may carry important information on current social, economic, and emotional landscapes, but run the risk of being completely buried and overlooked due to the sheer quantity of text that is produced every day.
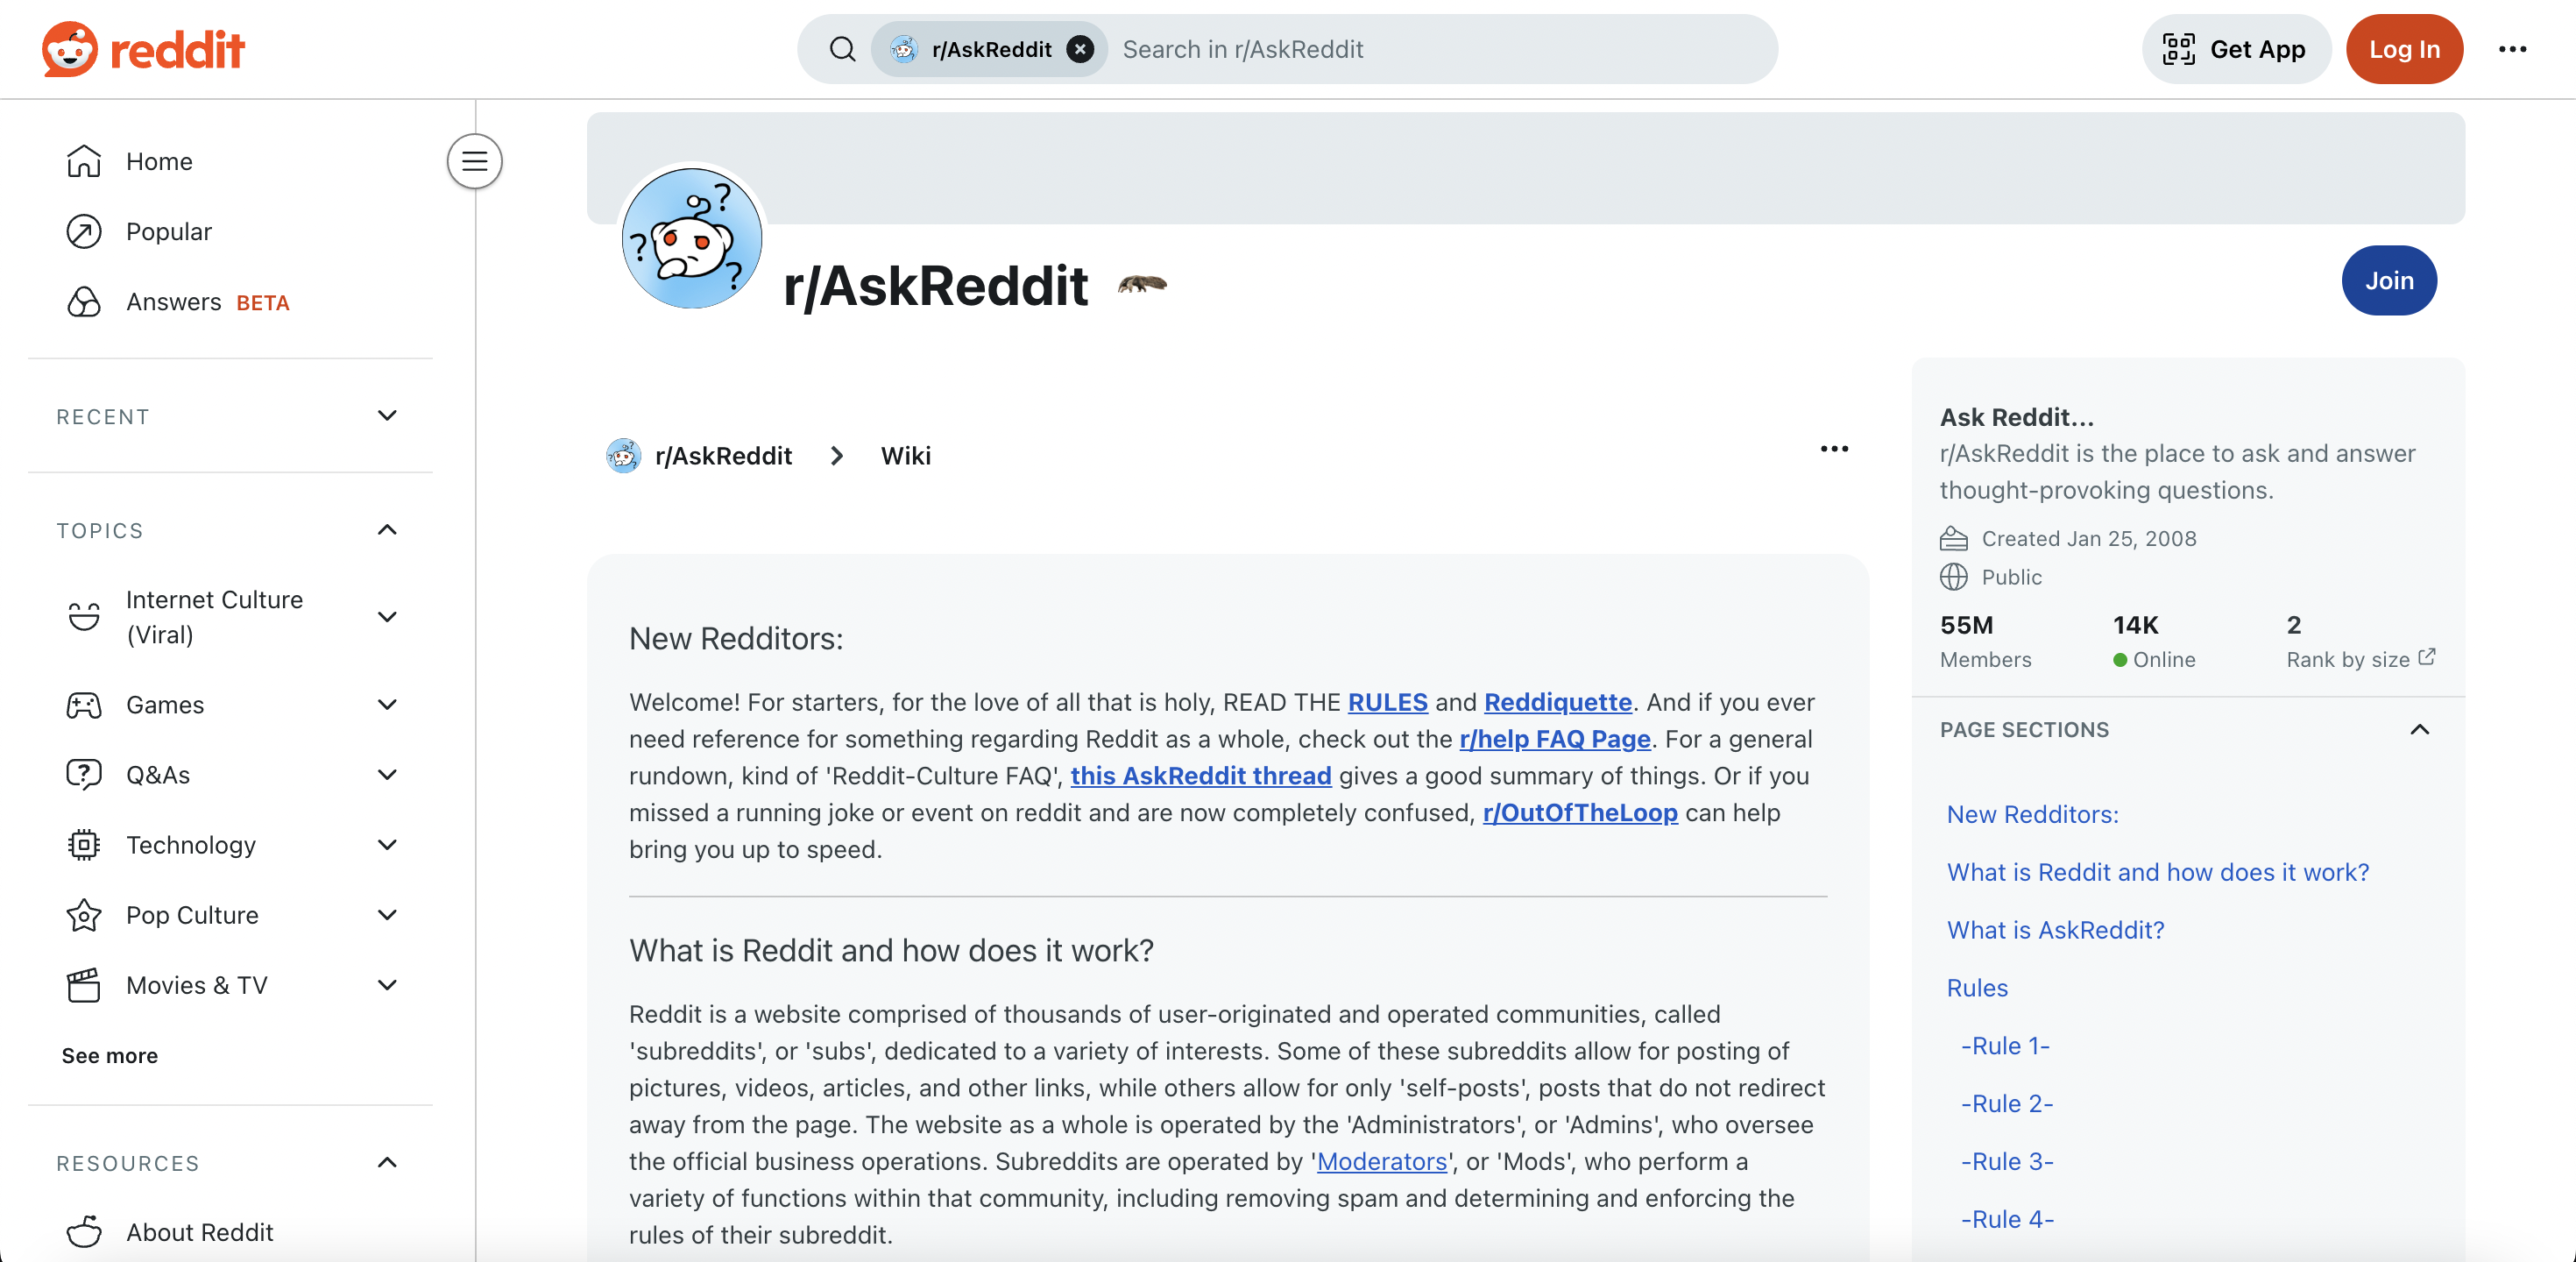
One such example of a source of user-generated texts is Reddit, an American social media platform that is currently one of the most visited websites in the world with currently more than 500 million users. The website includes over 100000 subreddits, which form communities of common interest where users can gather to post text, images, and other content regarding particular topics. With more than 55 million members, the second most popular subreddit is r/AskReddit where users post questions for others to answer.
As my final project for Cornell's INFO 6350: Text Mining for History and Literature course in Fall 2024, I chose to complete a case study in using natural language processing methods as part of a workflow for visualizing answers to popular r/AskReddit questions.
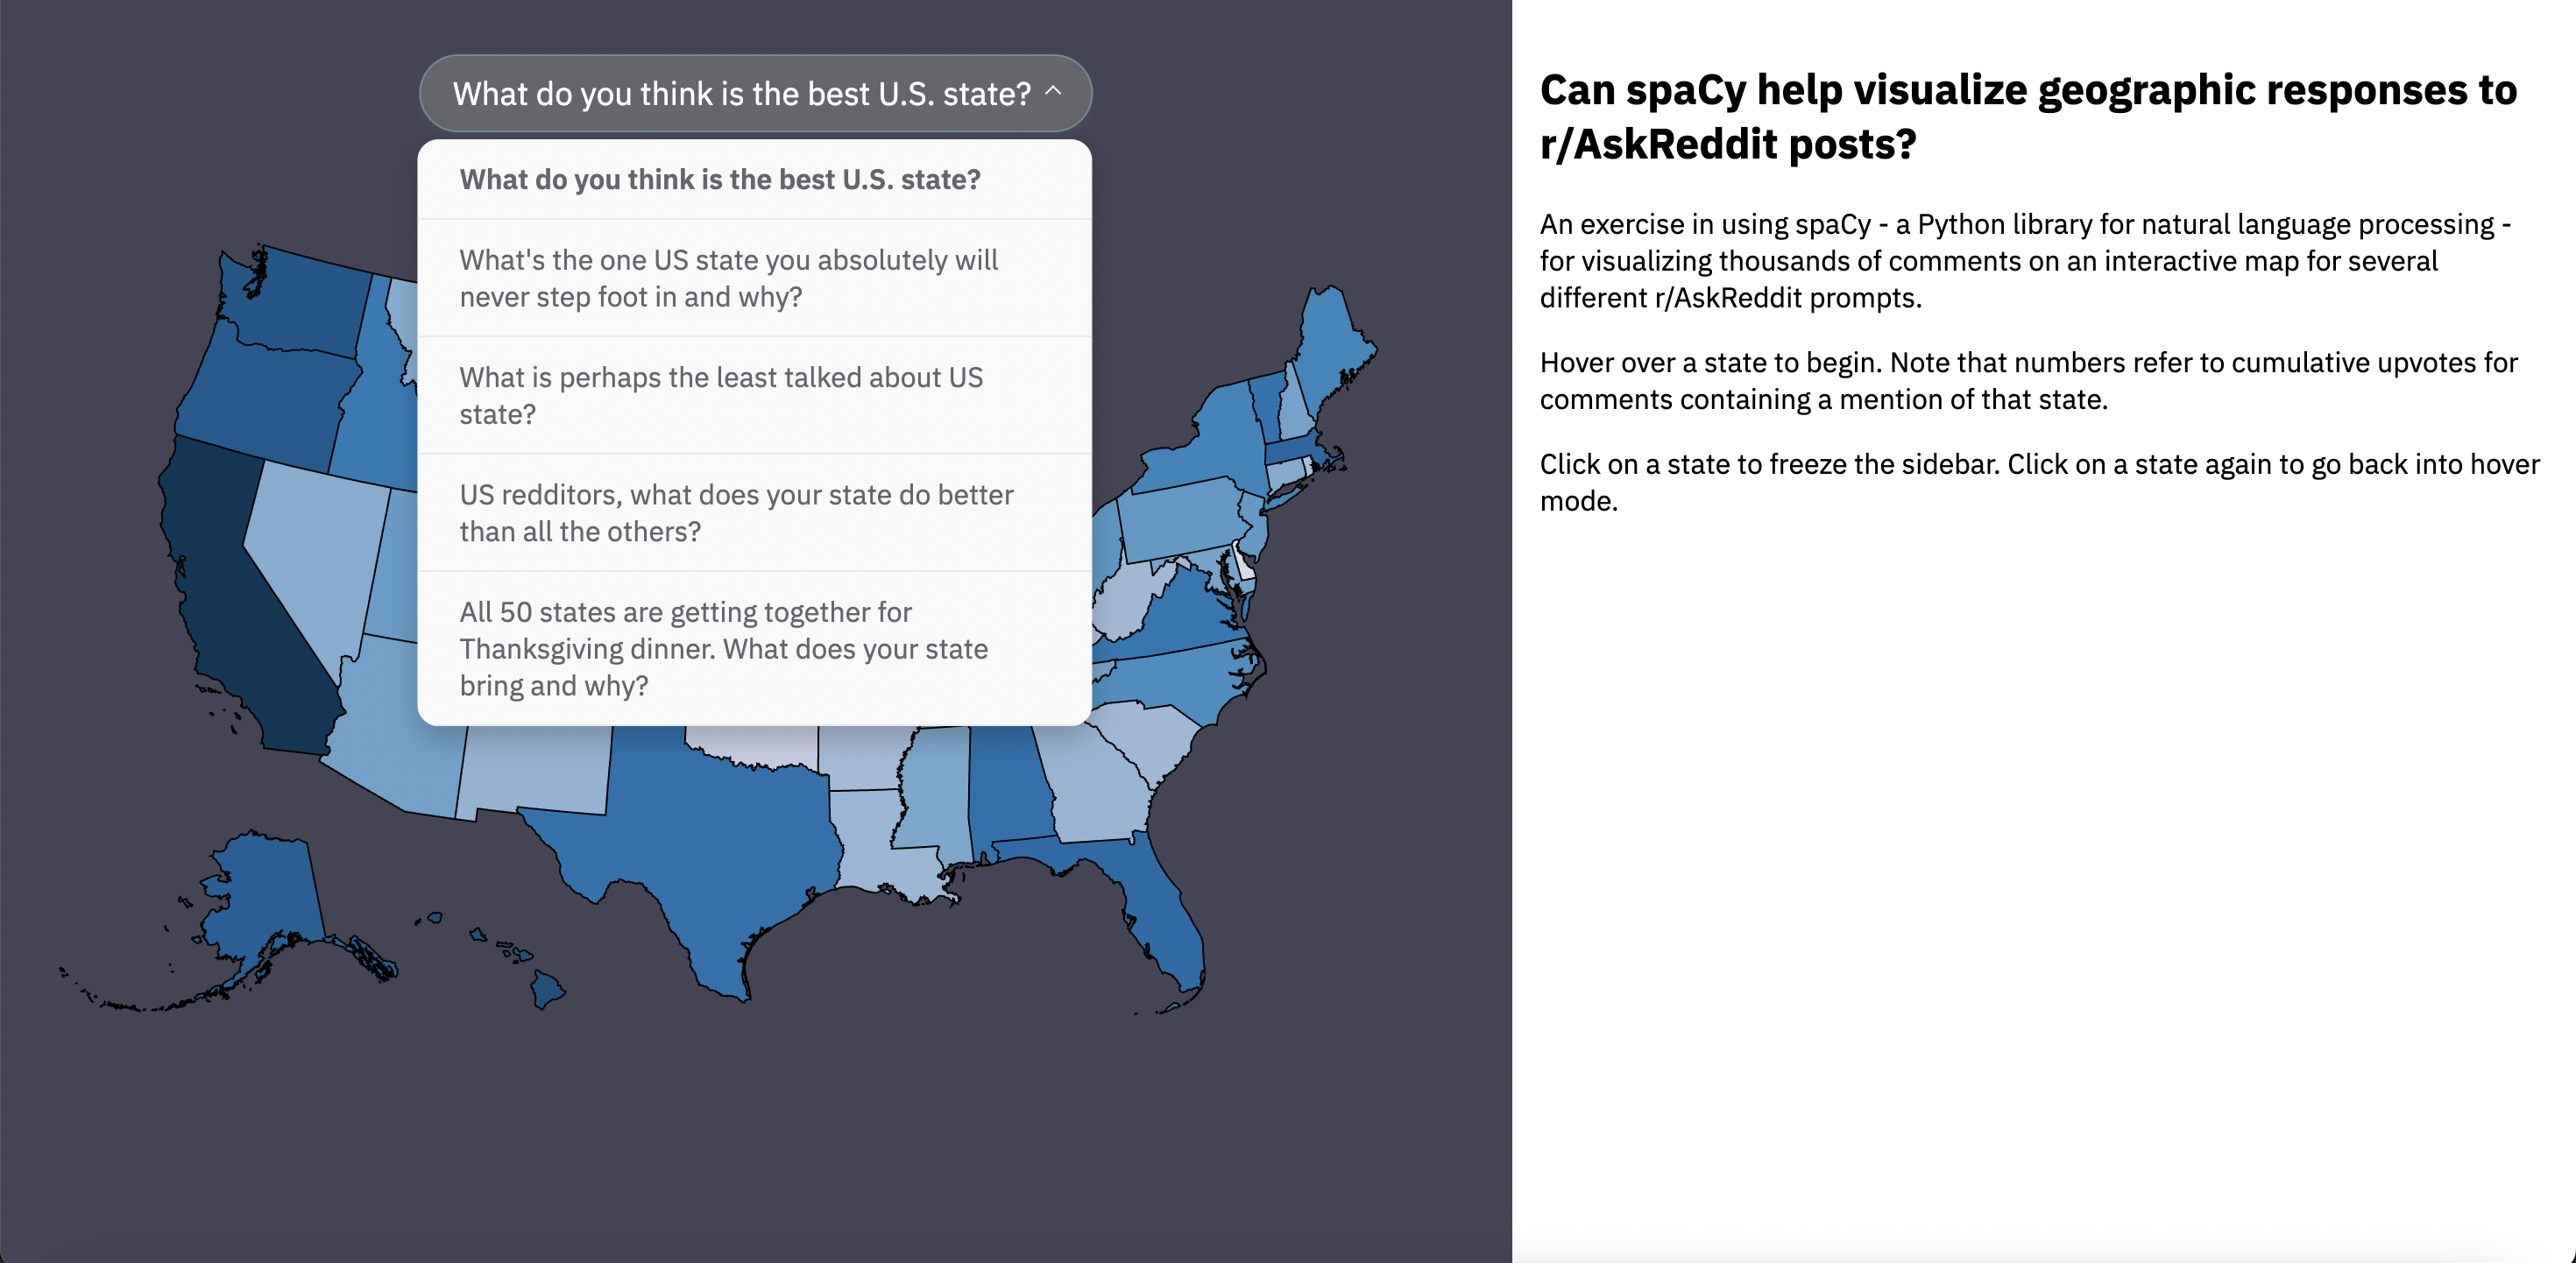
Using comments from five popular questions that naturally lend themselves to visualization on a U.S. map:
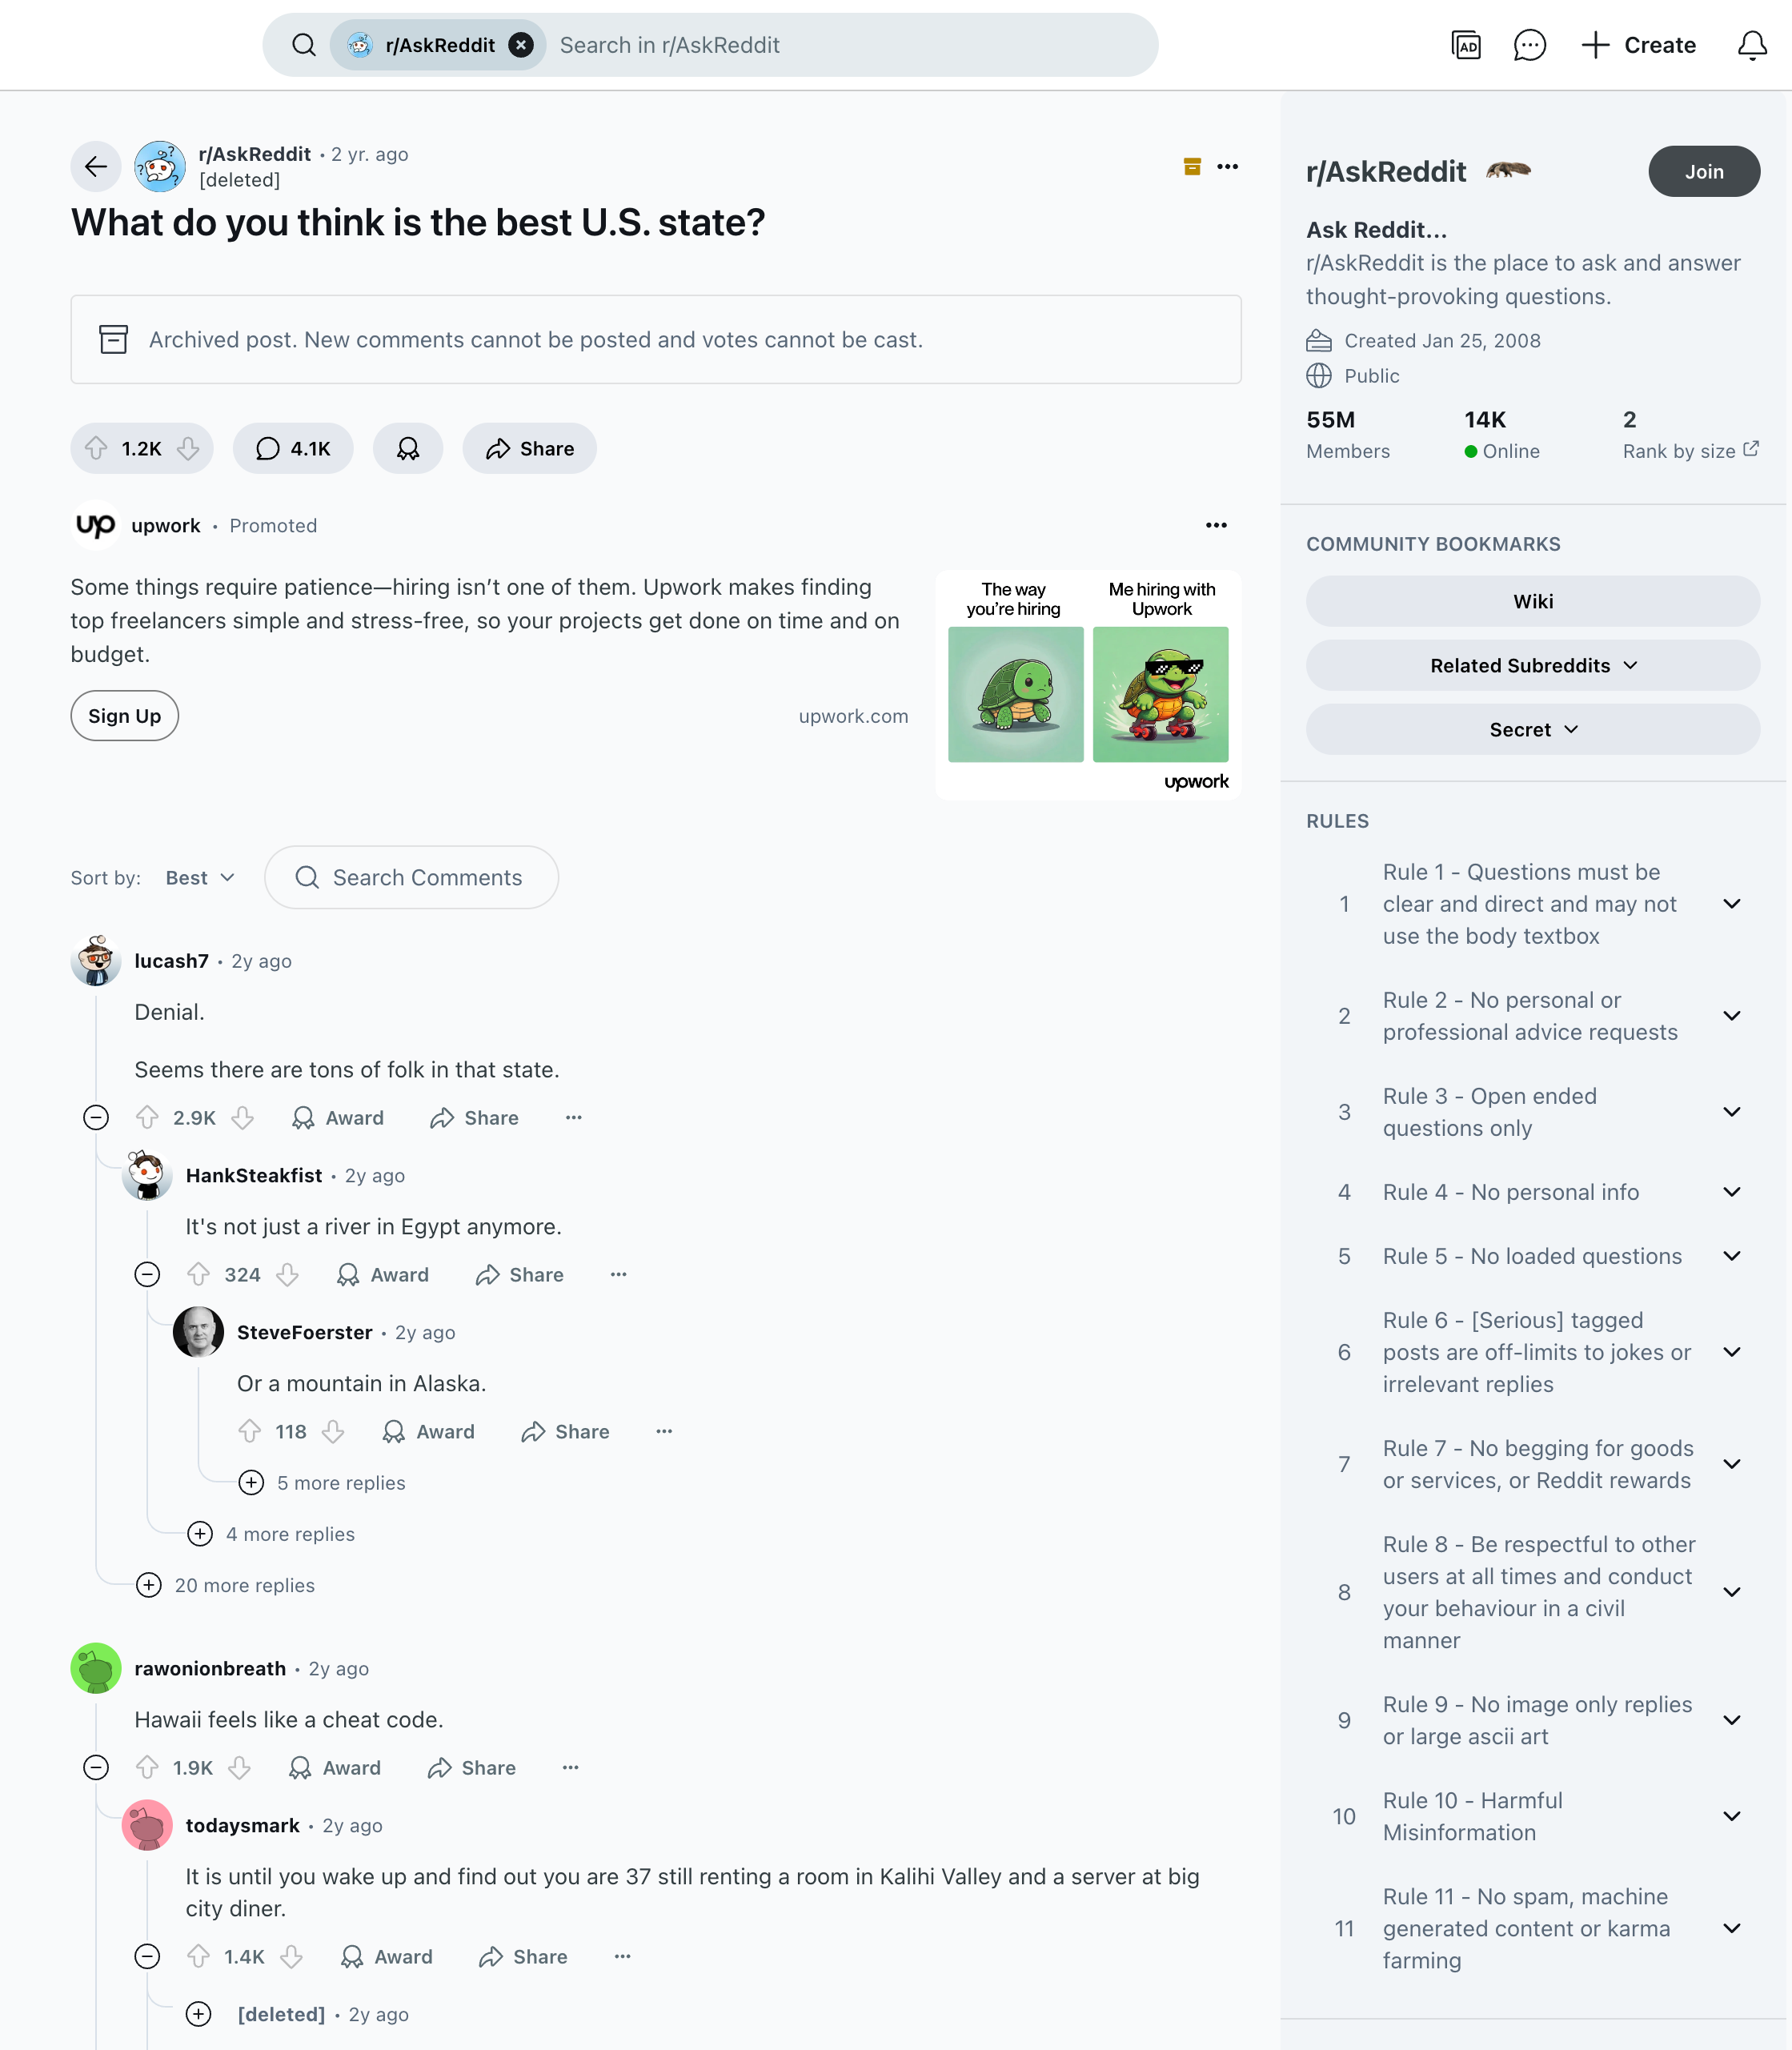
- What do you think is the best U.S. state? (4105 replies)
- What's the one US state you absolutely will never step foot in and why? (10864 replies)
- What is perhaps the least talked about US state? (5580 replies)
- US redditors, what does your state do better than all the others? (7775 replies)
- All 50 states are getting together for Thanksgiving dinner. What does your state bring and why? (7225 replies)
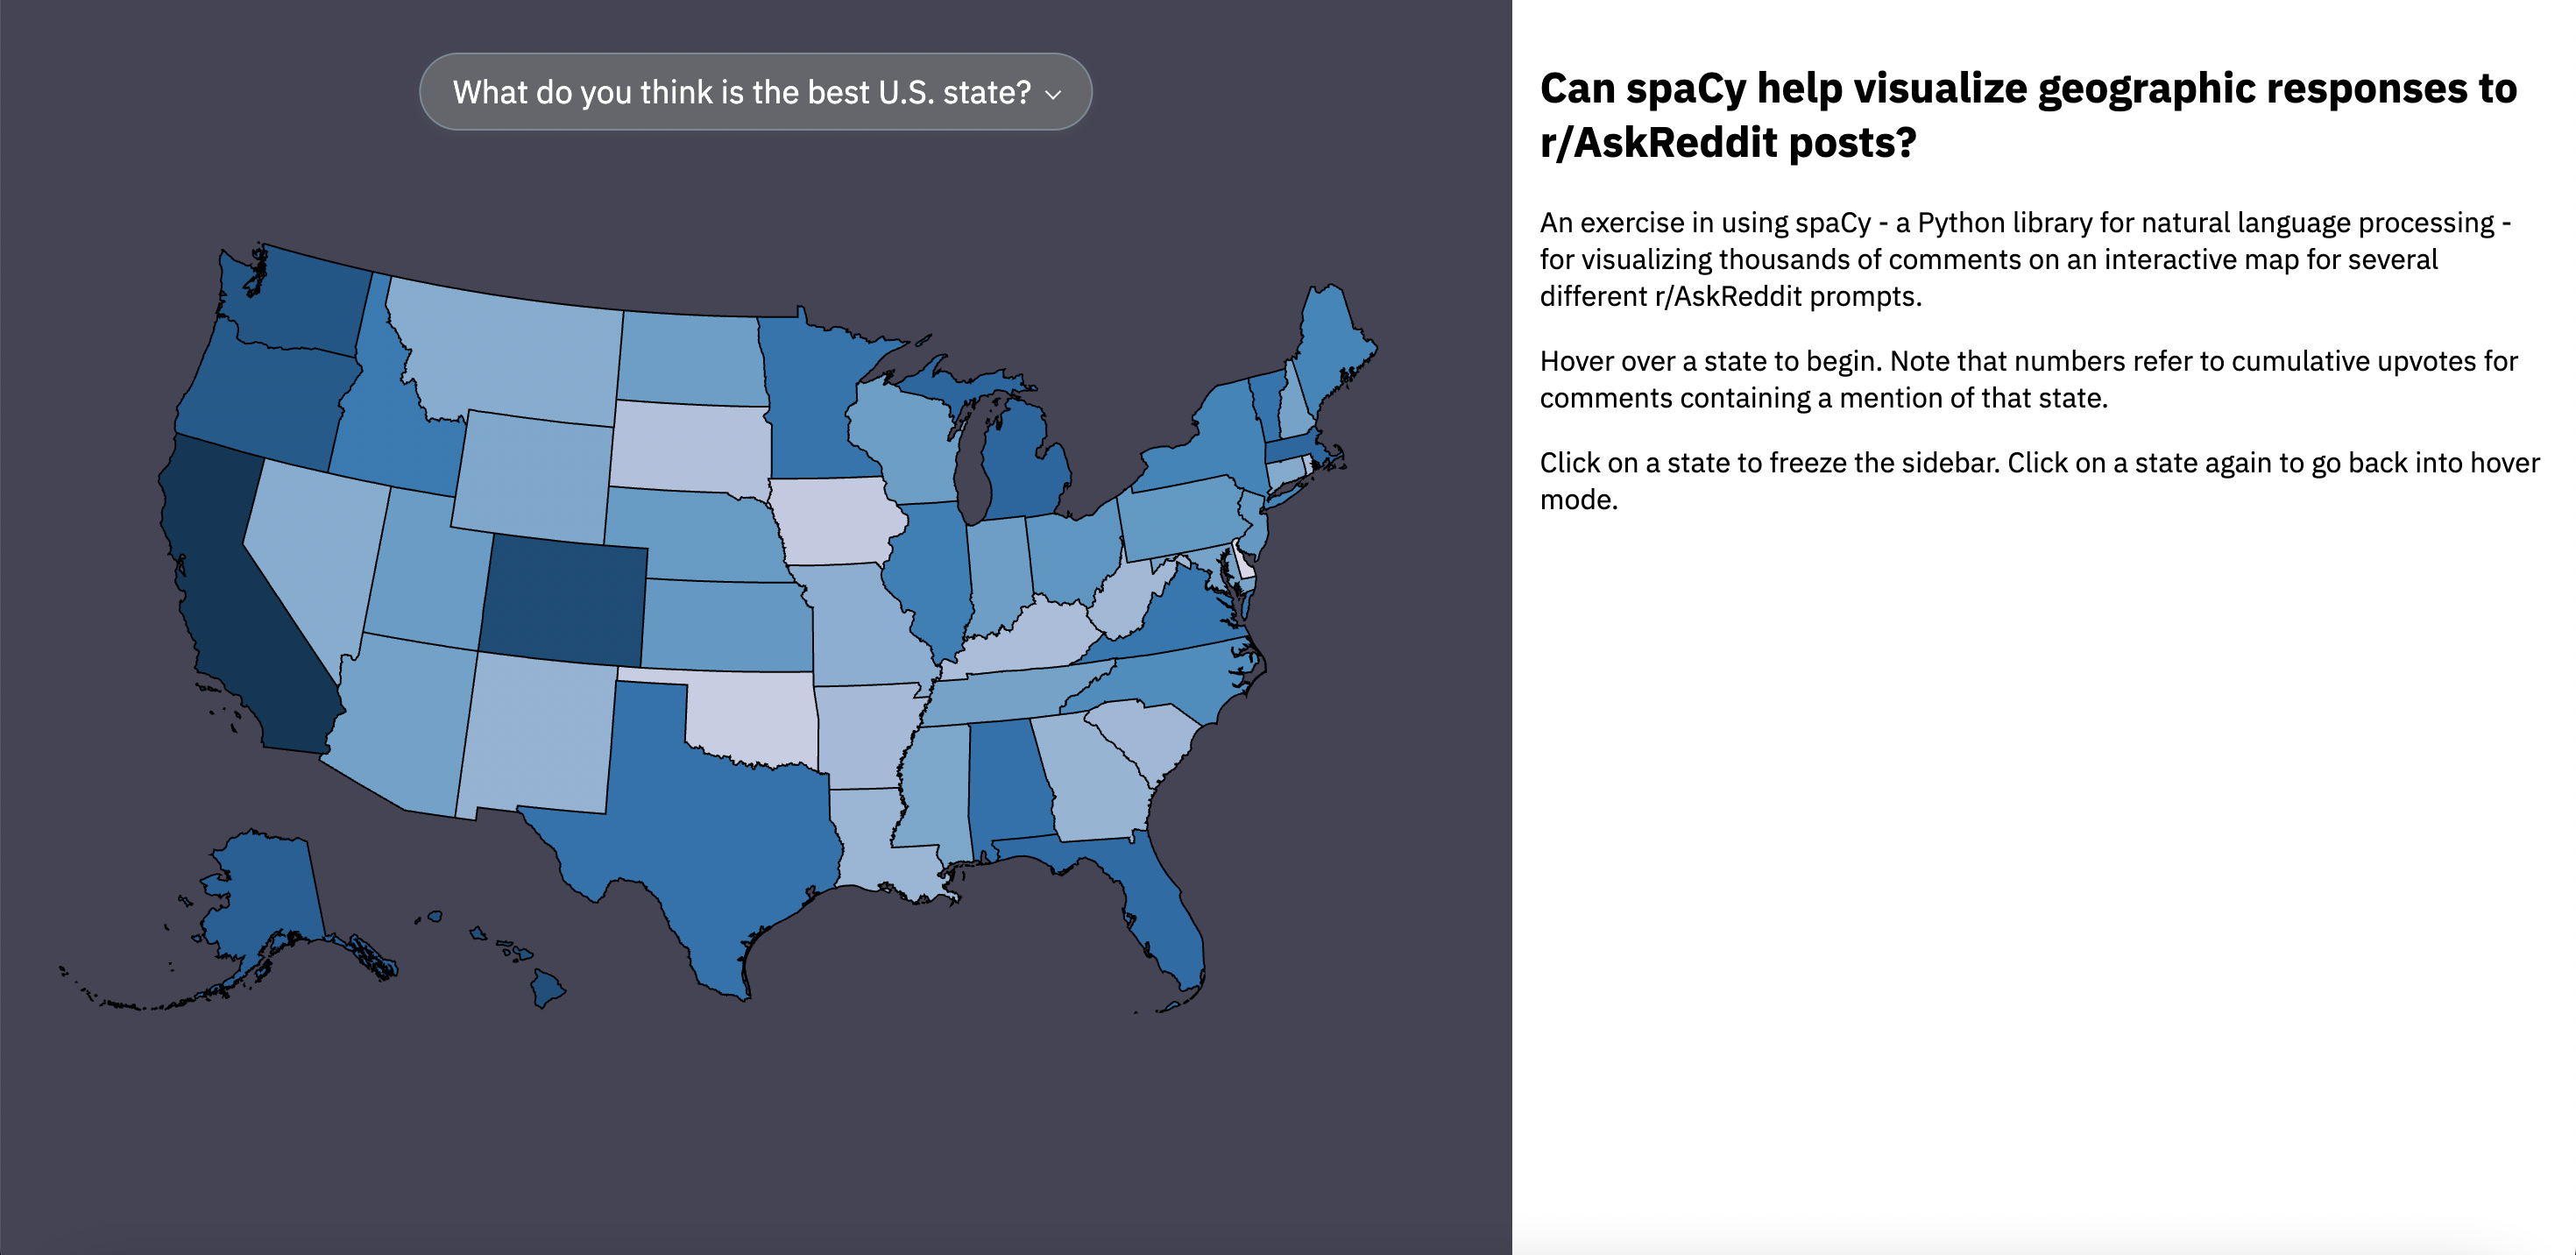
I wrote a set of Python functions that 1.) fetch all comments under a post using Reddit's API; 2.) use spaCy, a Python natural language processing library, to extract certain categories of information and index comments by the U.S. states they mention; 3.) transform this information into a structured json file.
In the final script, all that is needed to generate a visualization-ready file is calling one function with the URL to the Reddit post of interest. This file can then be passed to a web interface that uses D3.js to build an interactive map.
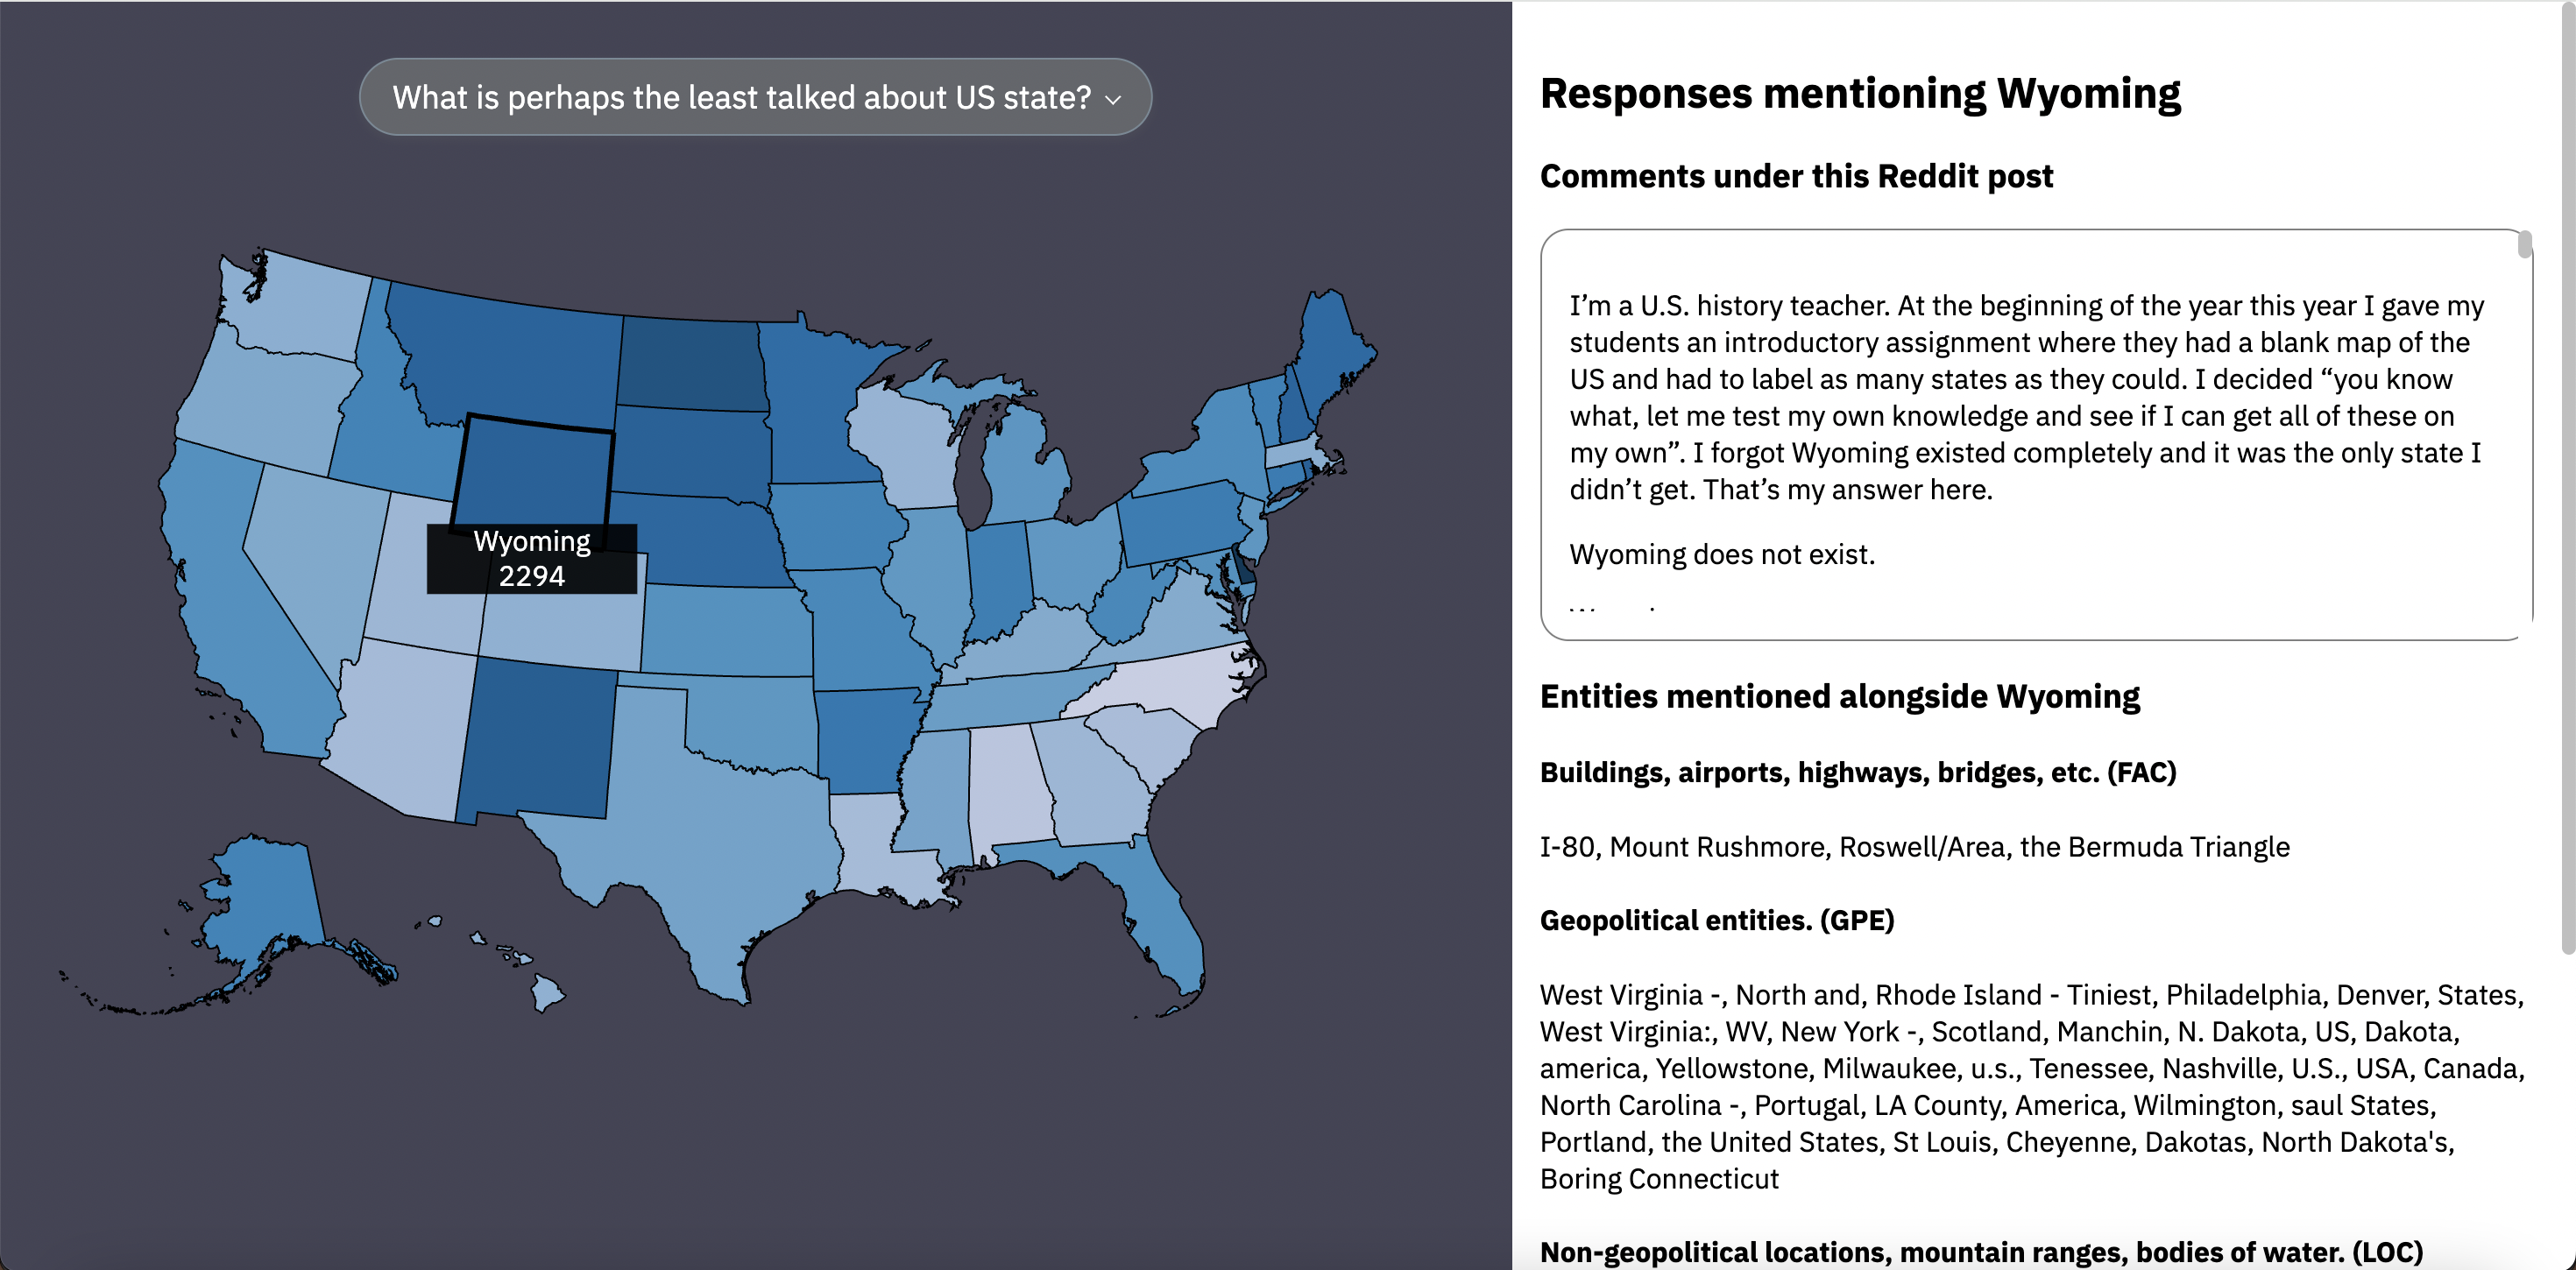
This visualization has a lot of opportunities for further refinement, especially since spaCy was used here in a basic manner by simply extracting entity names into a list. There are far more advanced NLP tools and methods that could be used to do things like resolving location co-references (in which multiple states are discussed in one comment). This would help clean up the entities found by spaCy in the sidebar by limiting the text output to only the most relevant entries.
However, there are some interesting patterns that arise by looking at the data this way - for example, we can see discussion noticeably shift to the least populated states when the question is about the least talked about state. Furthermore, comments about the best state tend to mention noteable landmarks and national parks, while comments about a state to never step foot in tend to involve discussion about political alignment and social identity groups.