Final Digital Destination
Visualizing illegal e-waste exports from U.S. recyclers
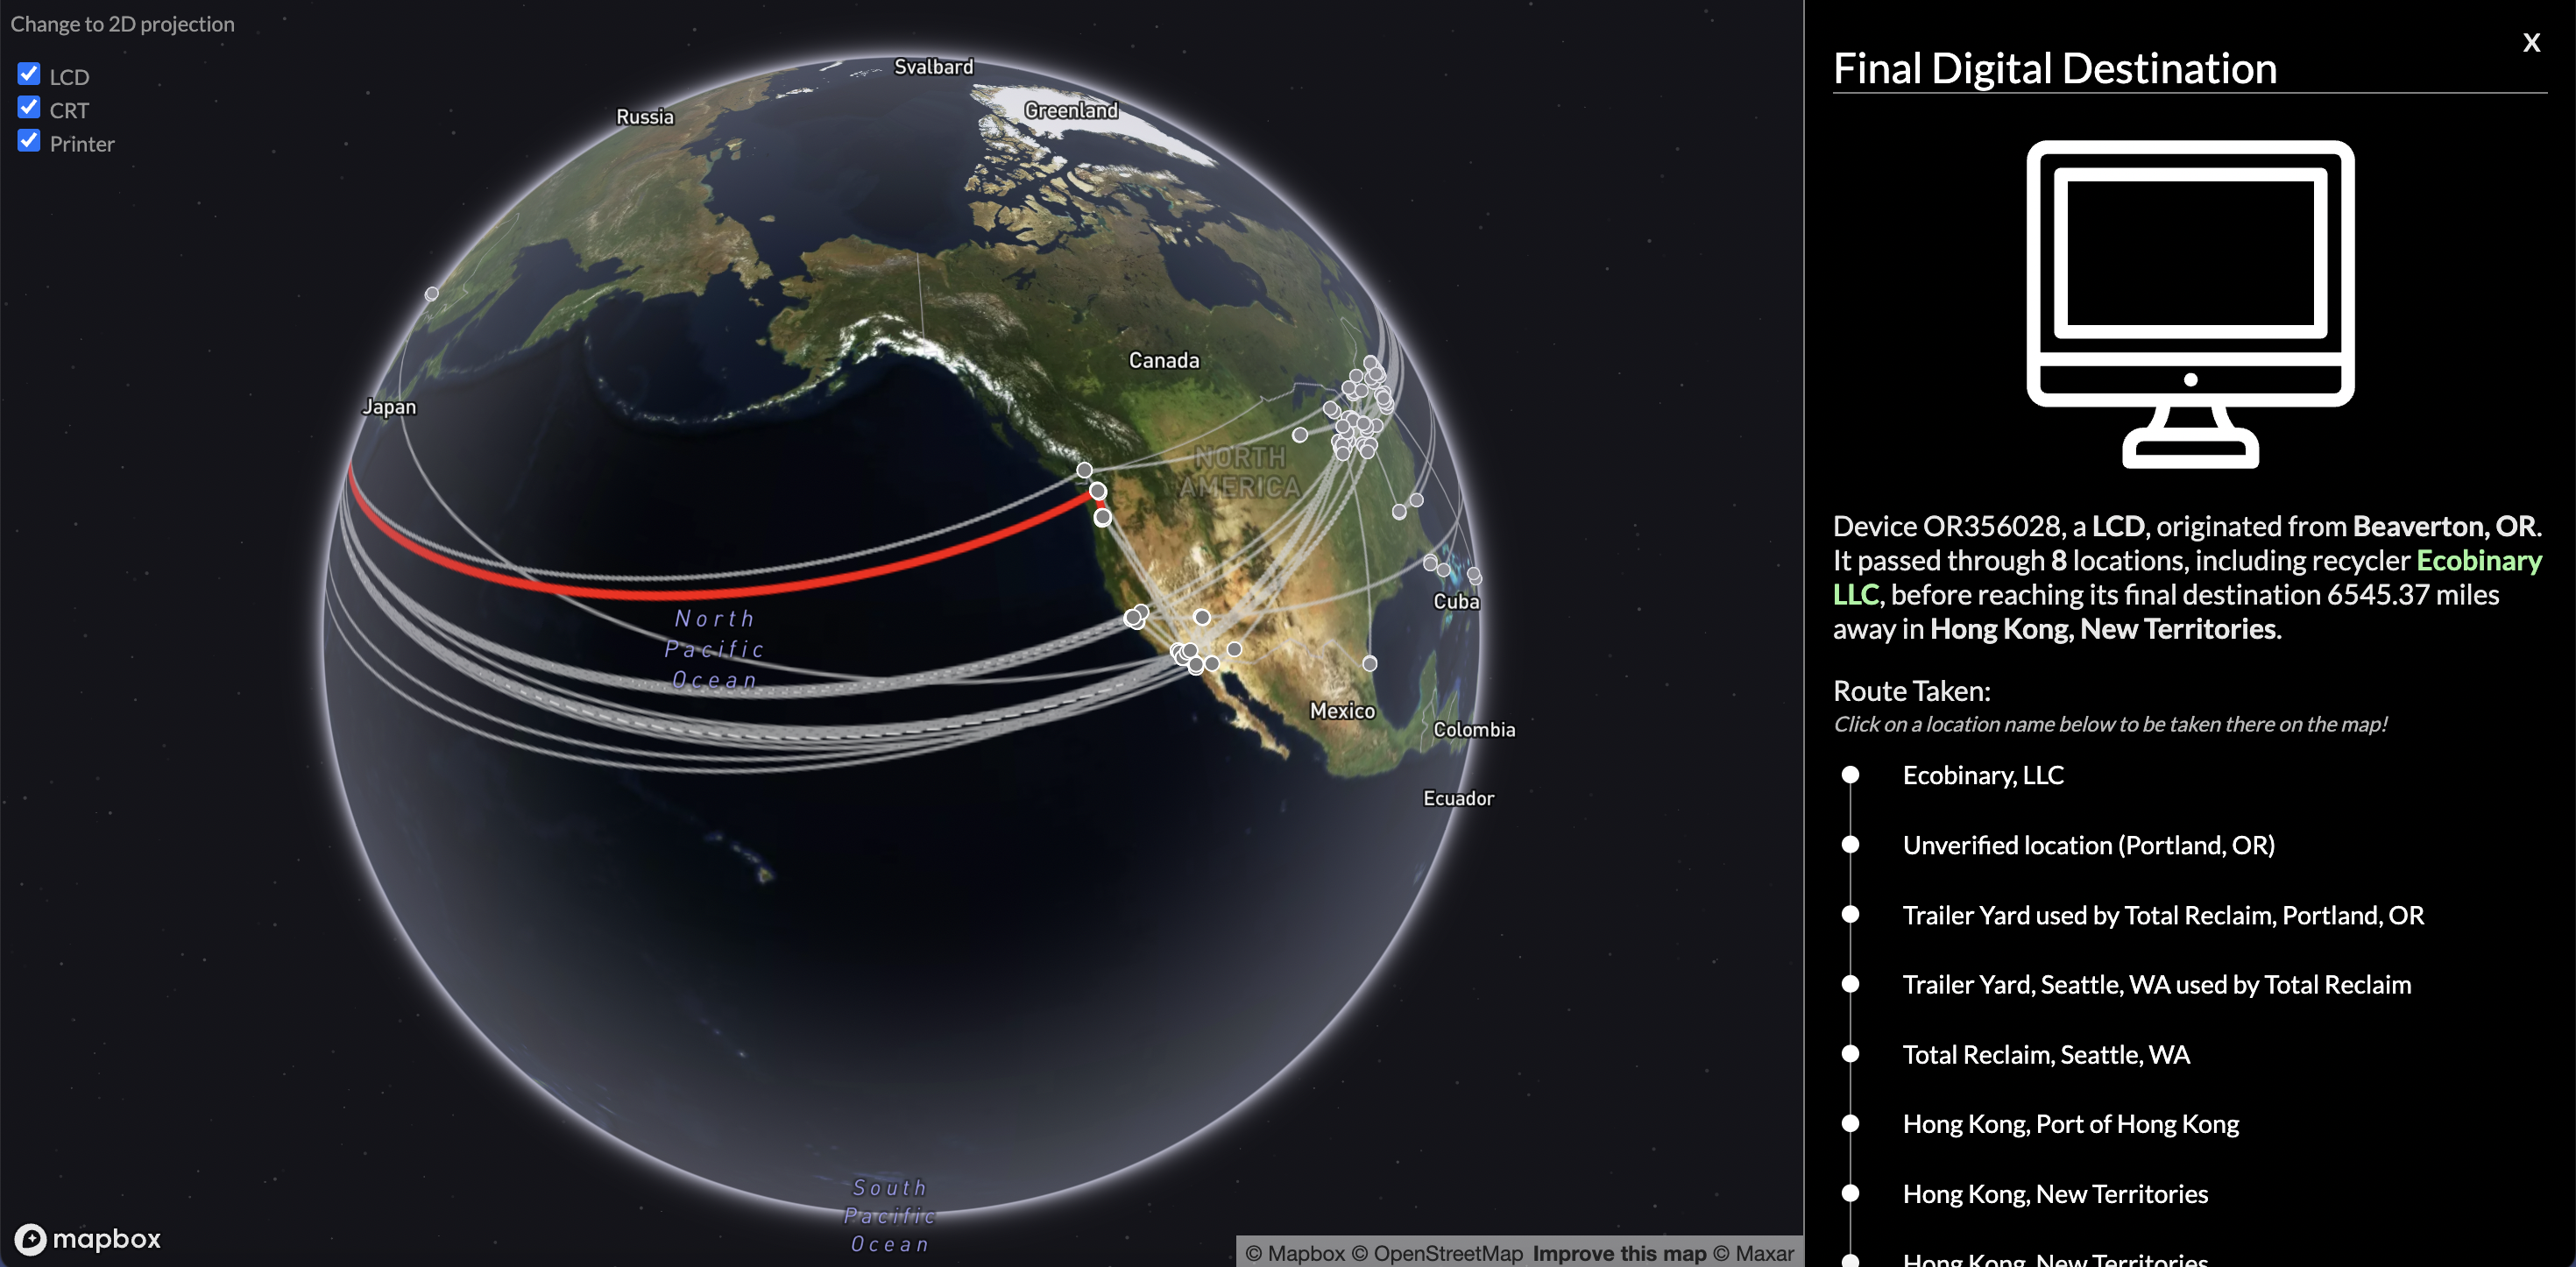
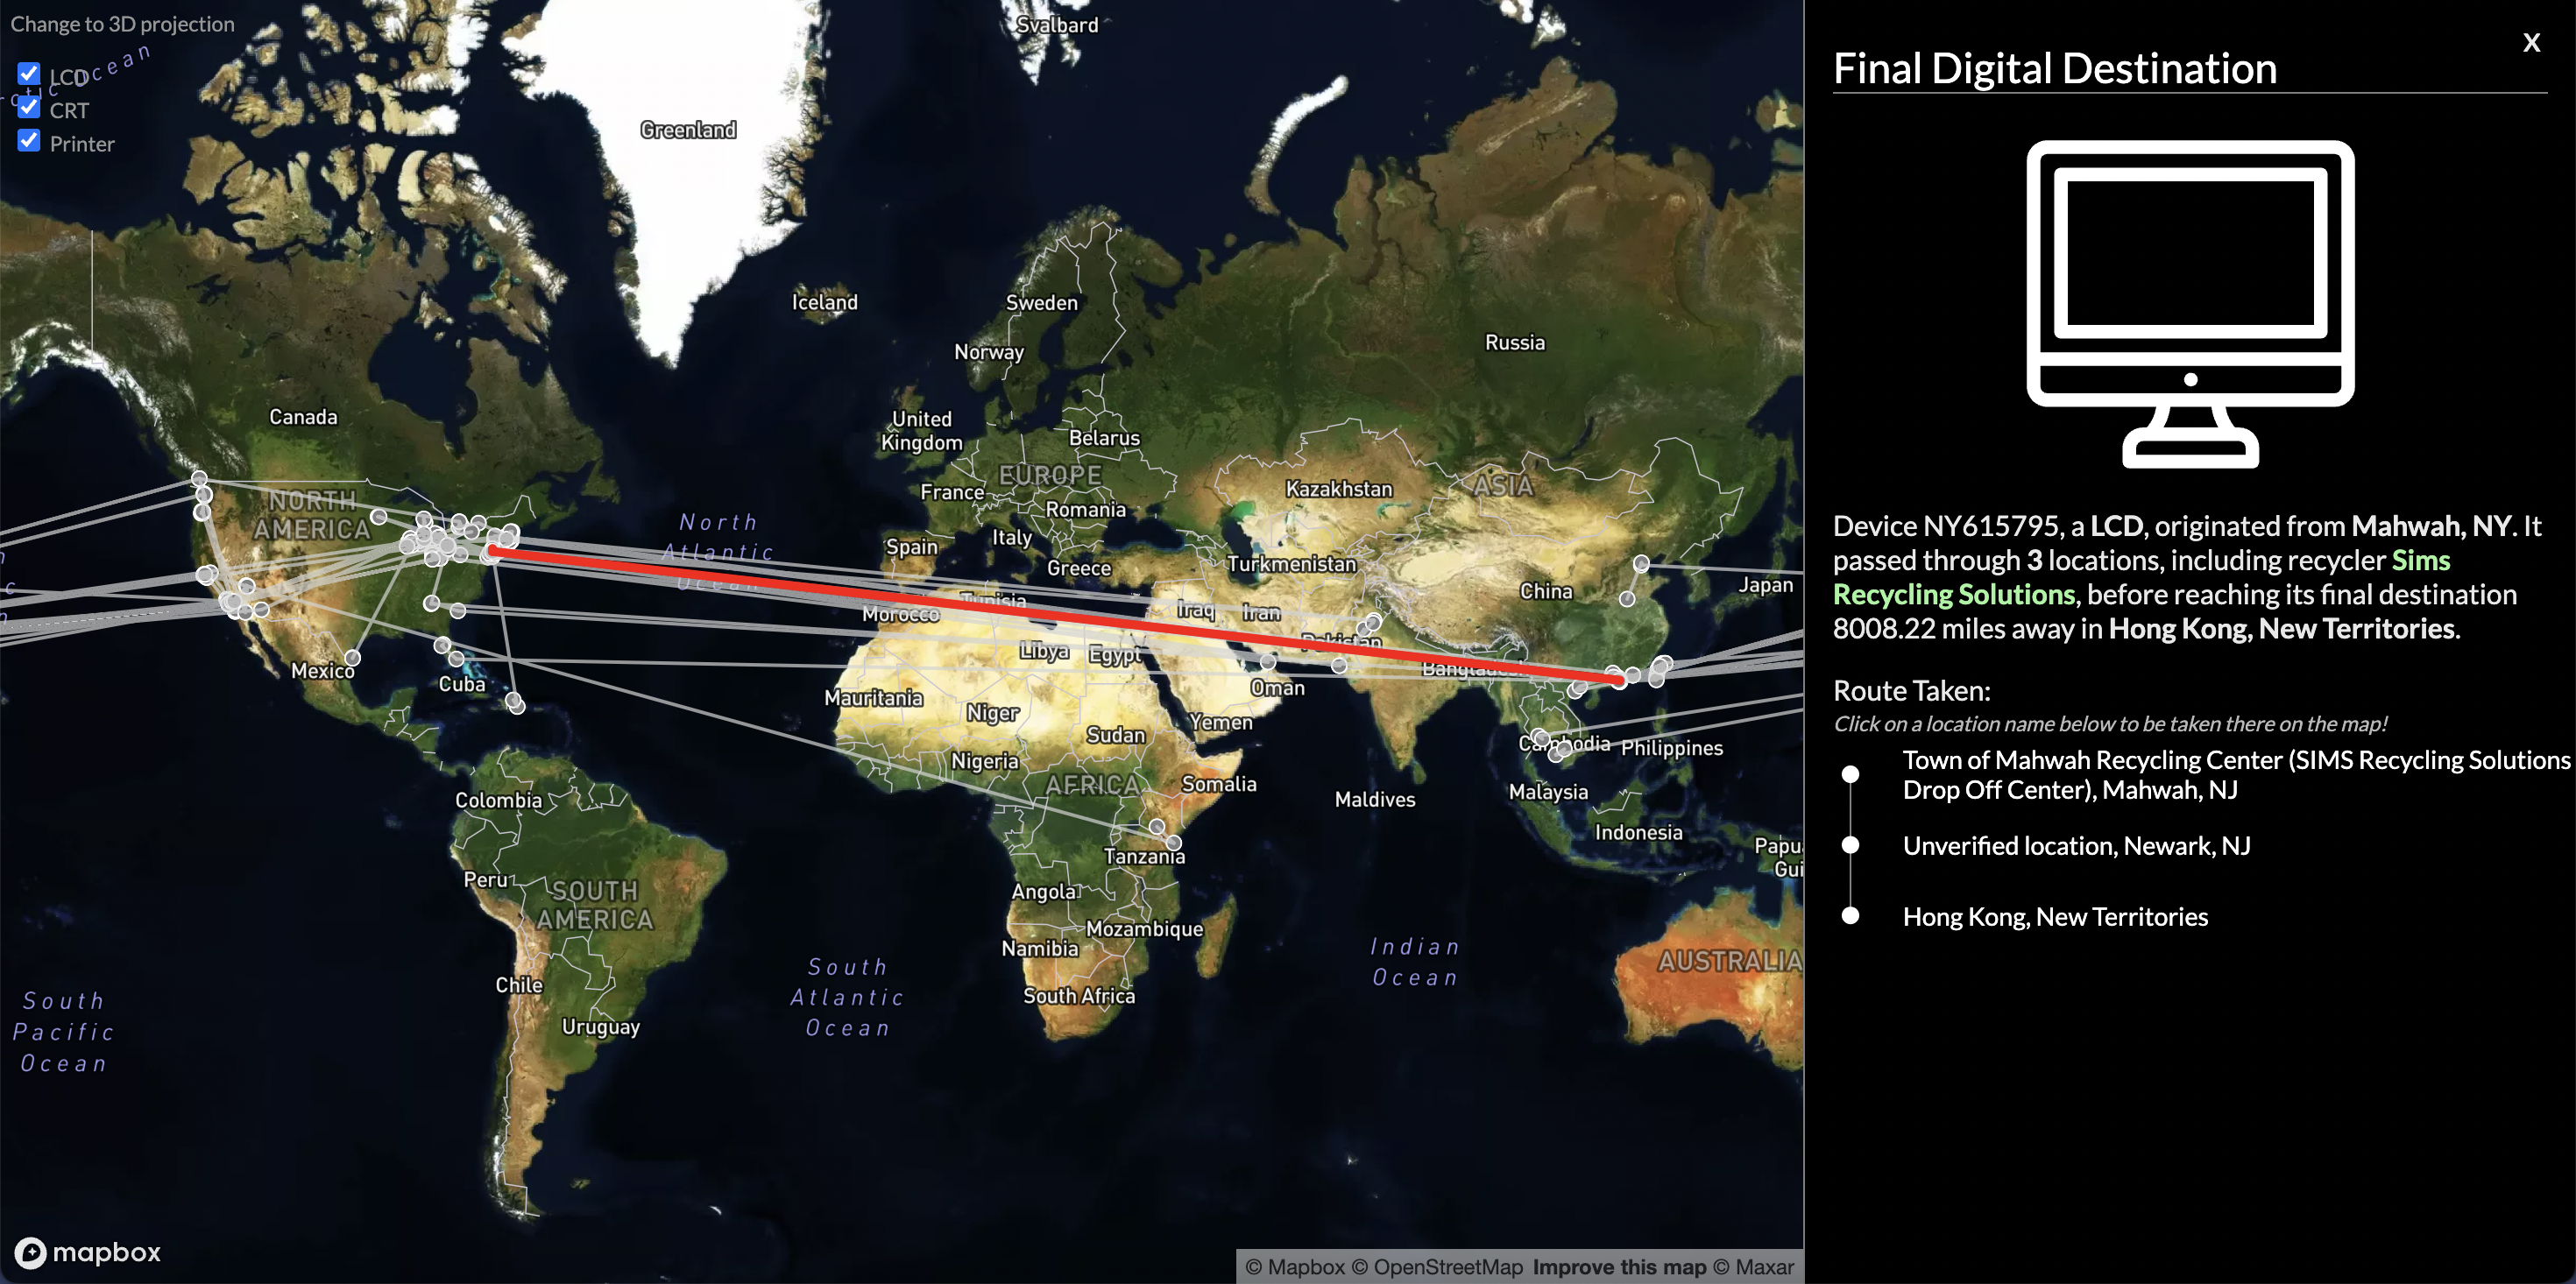
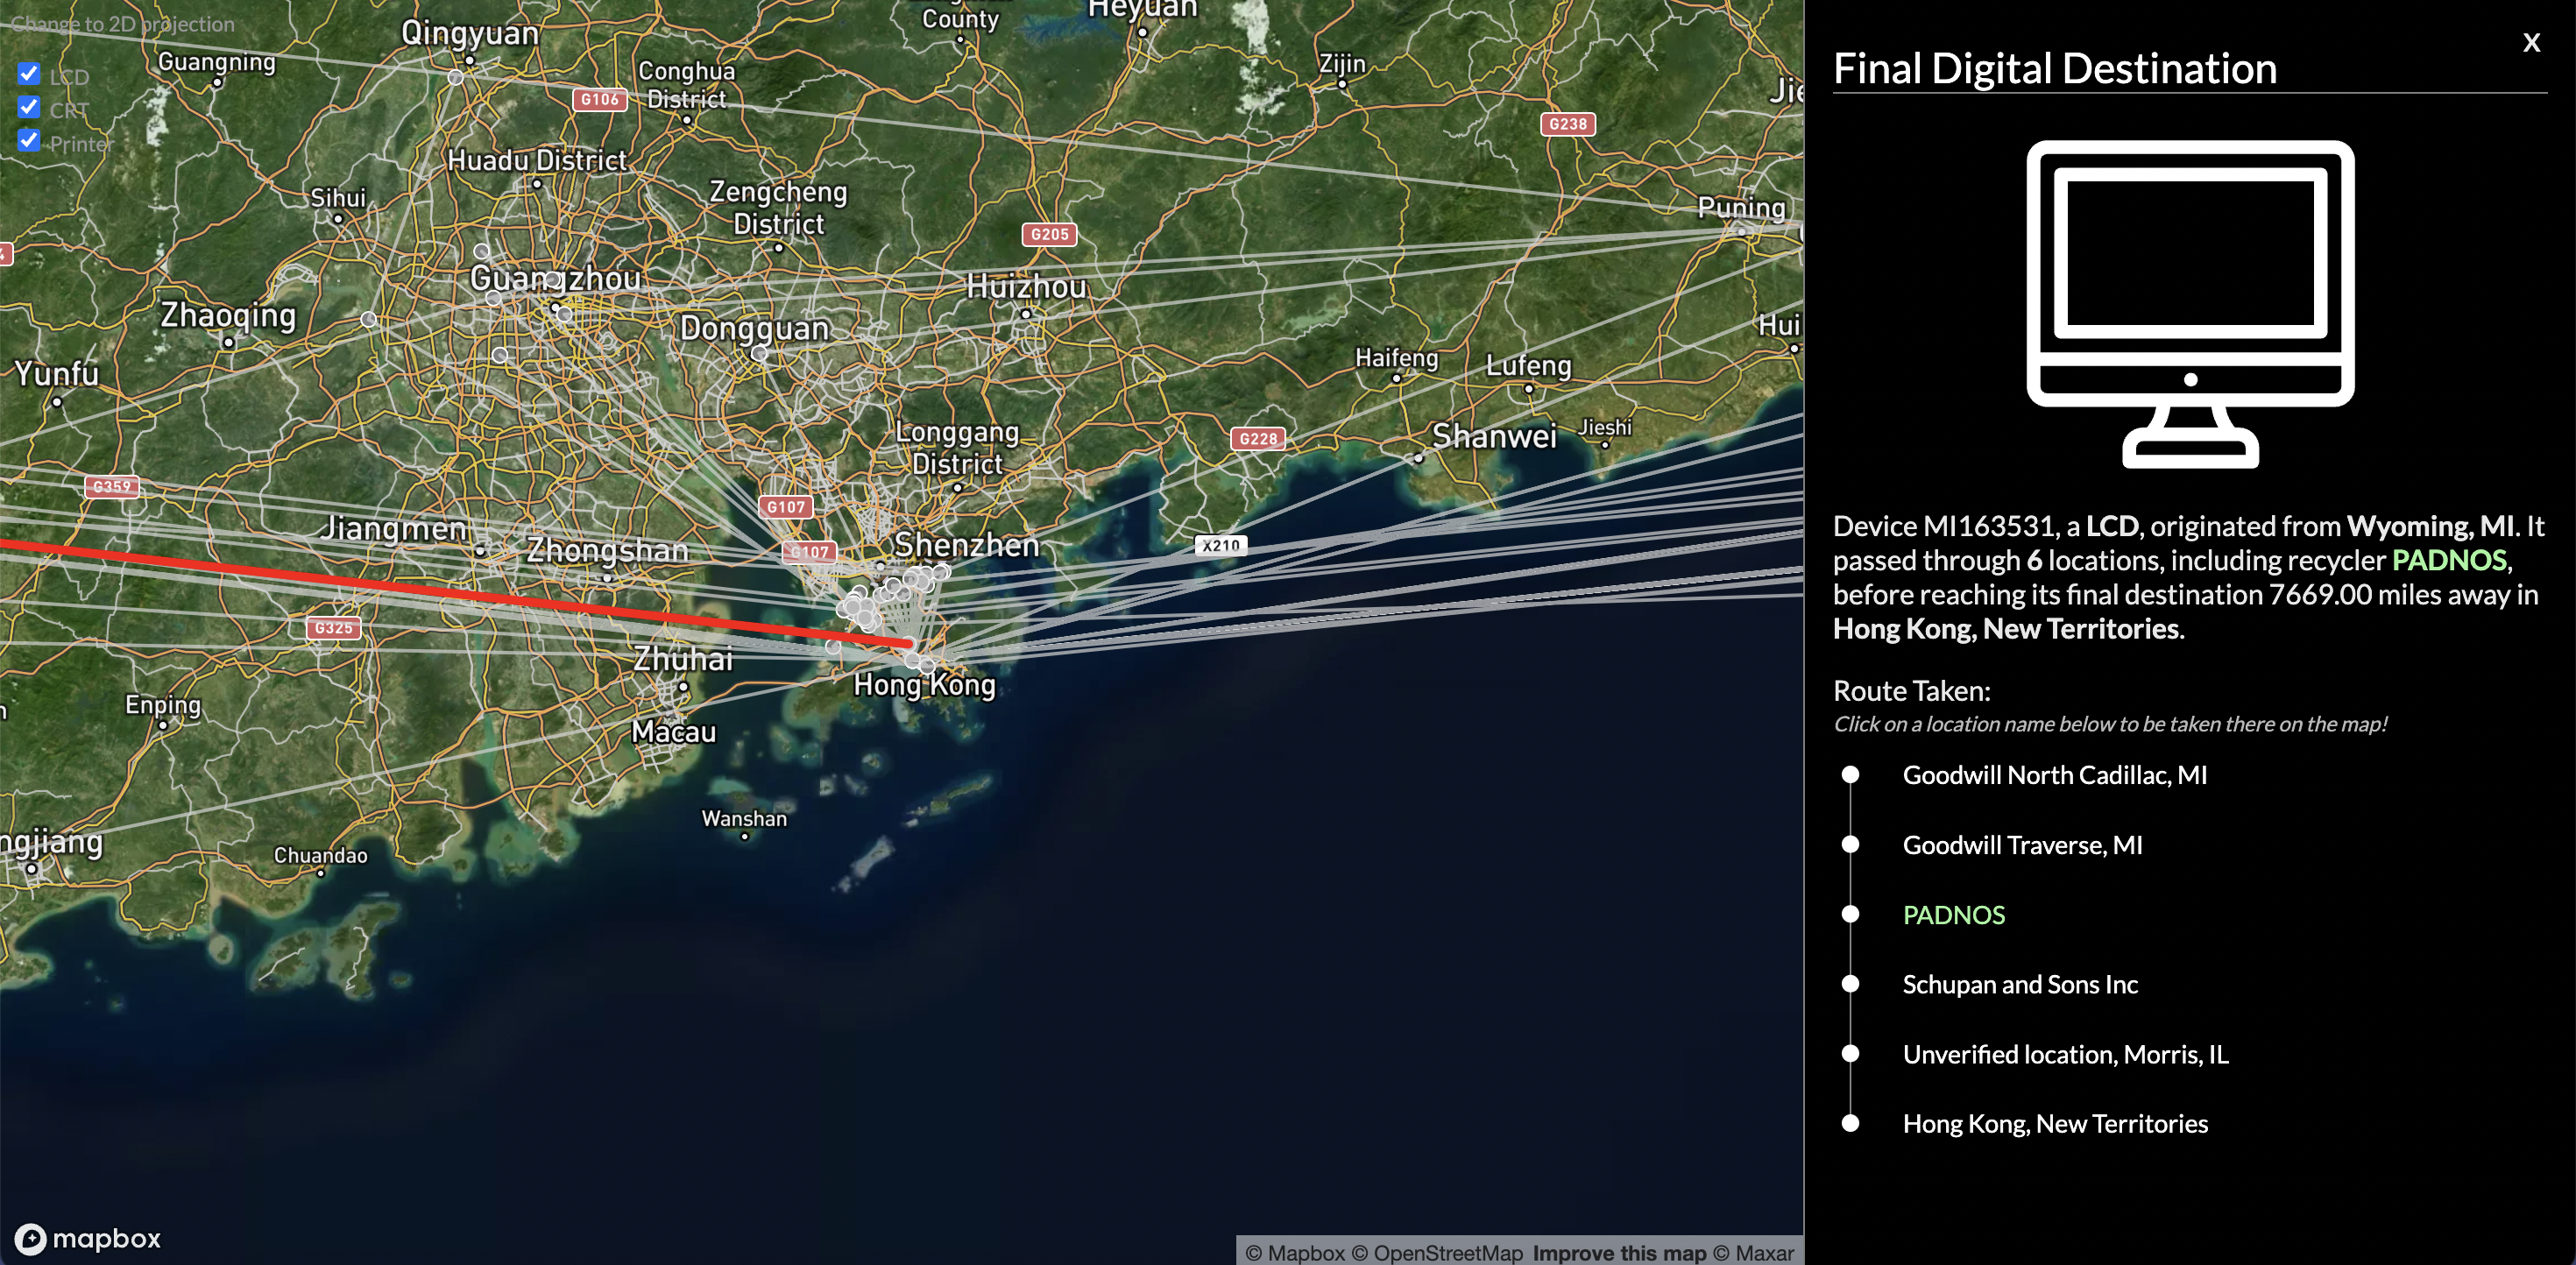
When a consumer drops off an old printer or monitor at a U.S. recycling center, where can they expect their device to go?
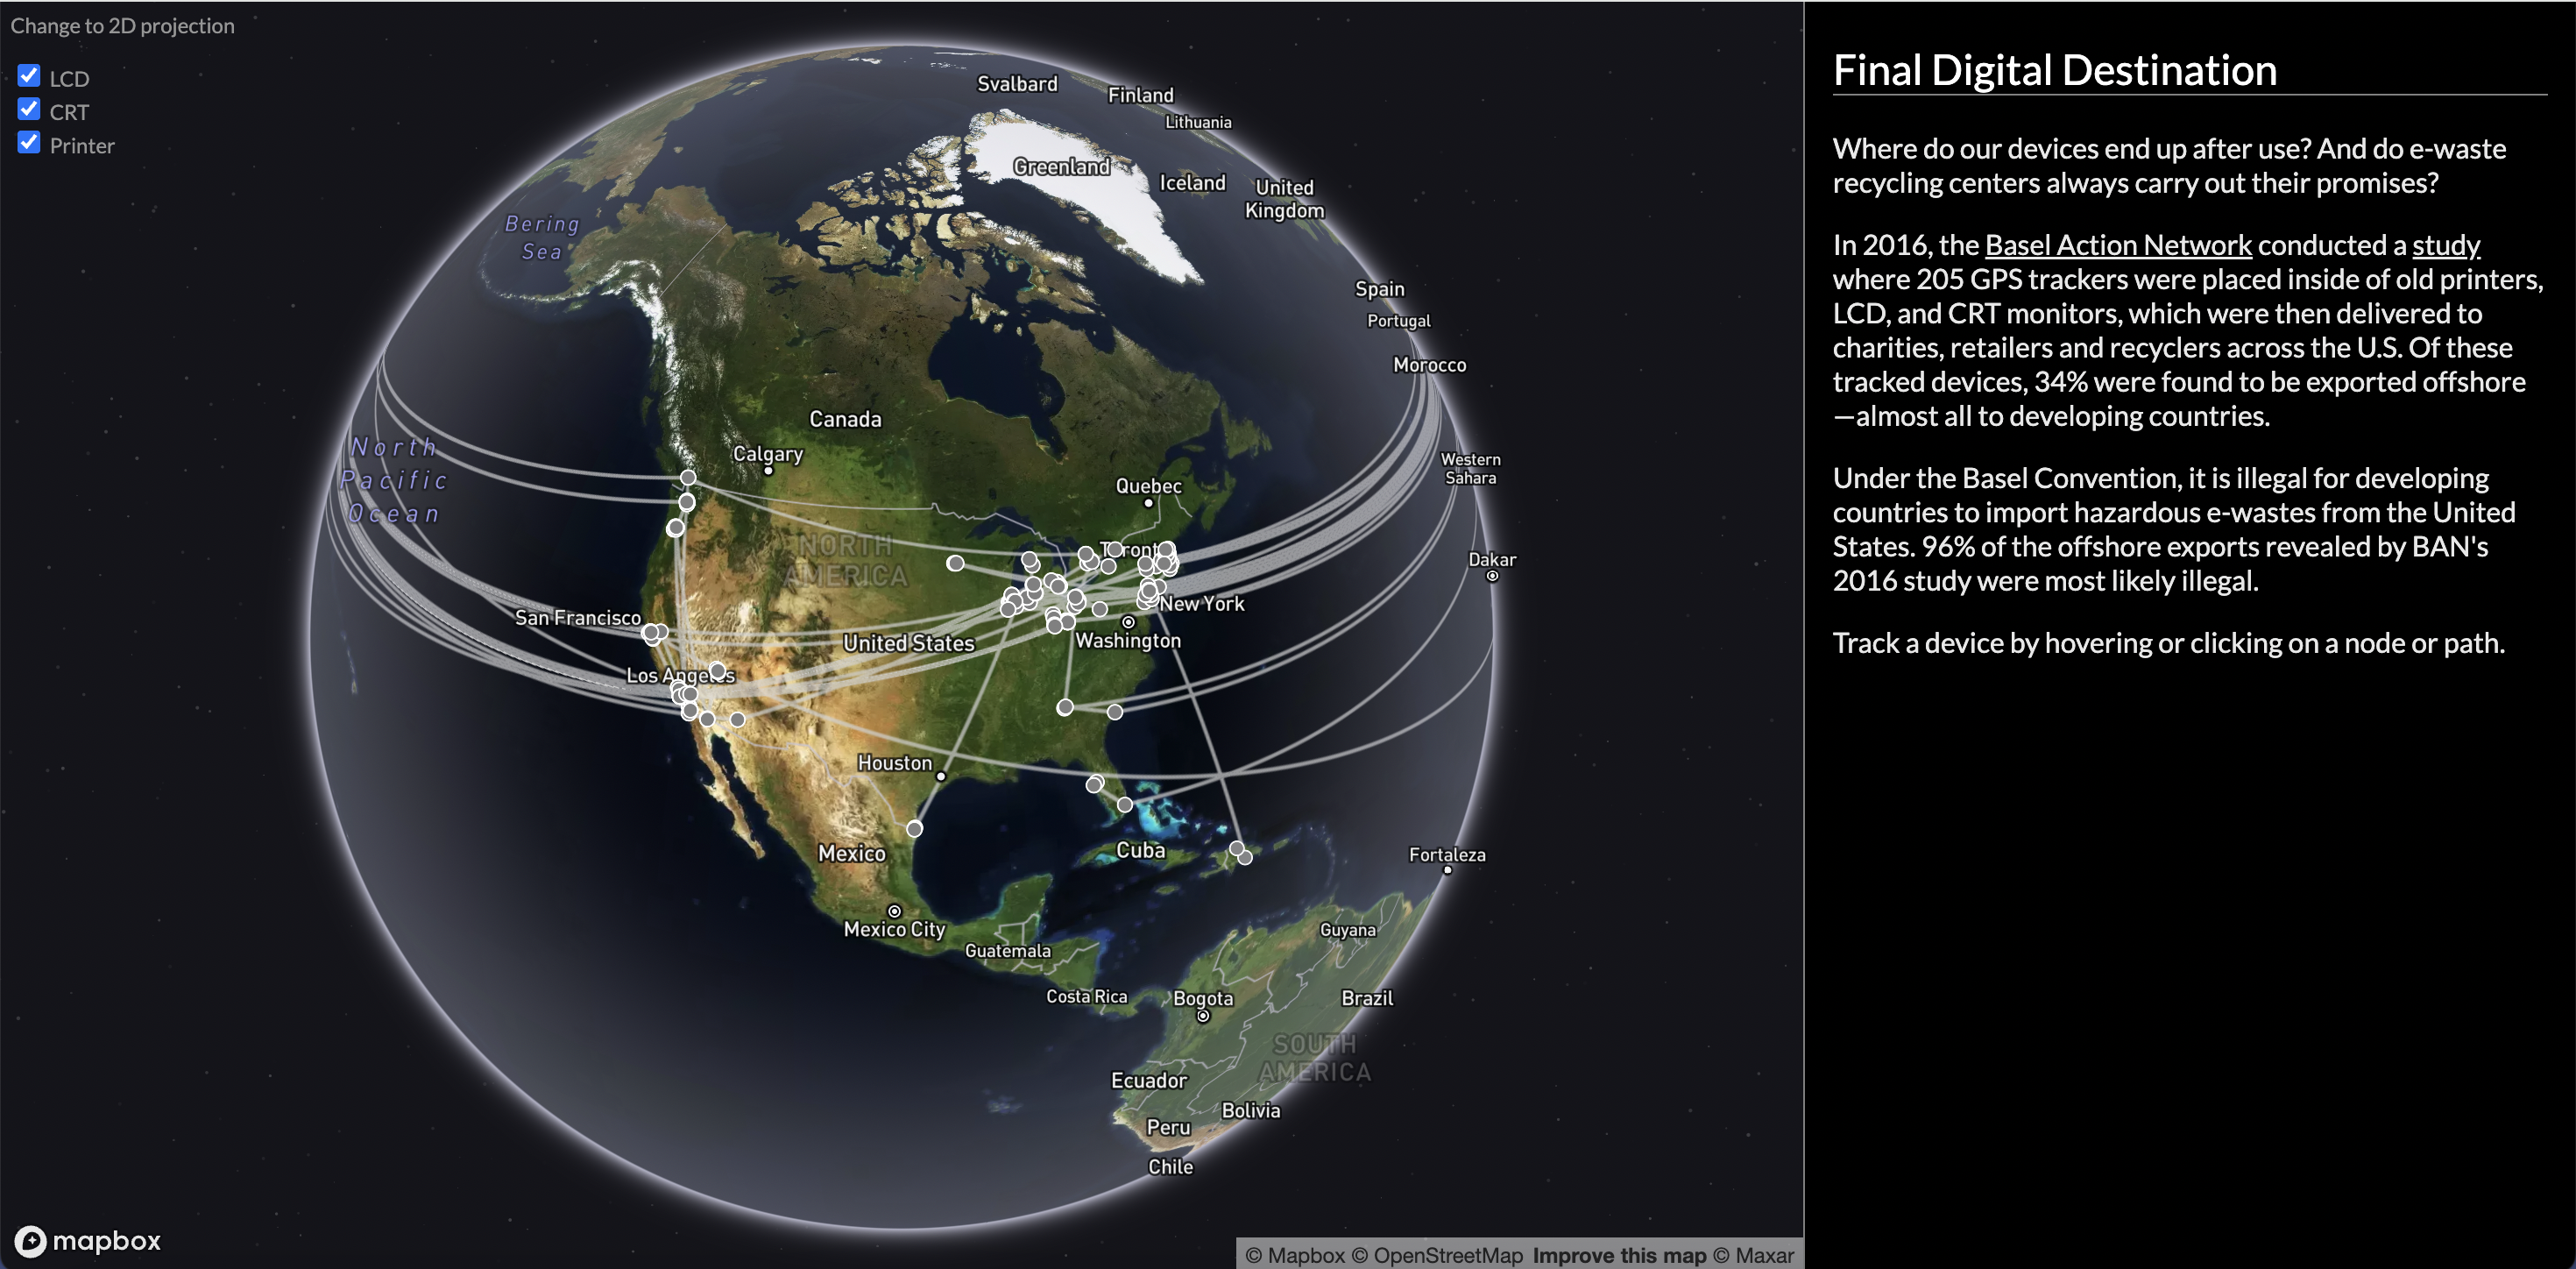
In 2016, the Basel Action Network aimed to find out by placing 205 trackers inside old devices and dropping them off at retailers, charities, and recycling centers across the United States. 34% of the devices were shipped offshore, almost all to developing countries where they were often dismantled by low-wage workers in unsafe conditions. Of these offshore exports, 96% were likely illegal under the Basel Convention, an international treaty that prohibits the export of hazardous waste from developed to developing countries.
This visualization was created as my final project for Cornell's INFO 5260: Computing On Earth: Planetary Dimensions and Consequence of Computing course in Spring 2024.
The goal was to take public data provided by the Basel Action Network on their 2016 study - provided in PDF format as seen below - and to display the information in an interactive web map of the globe.
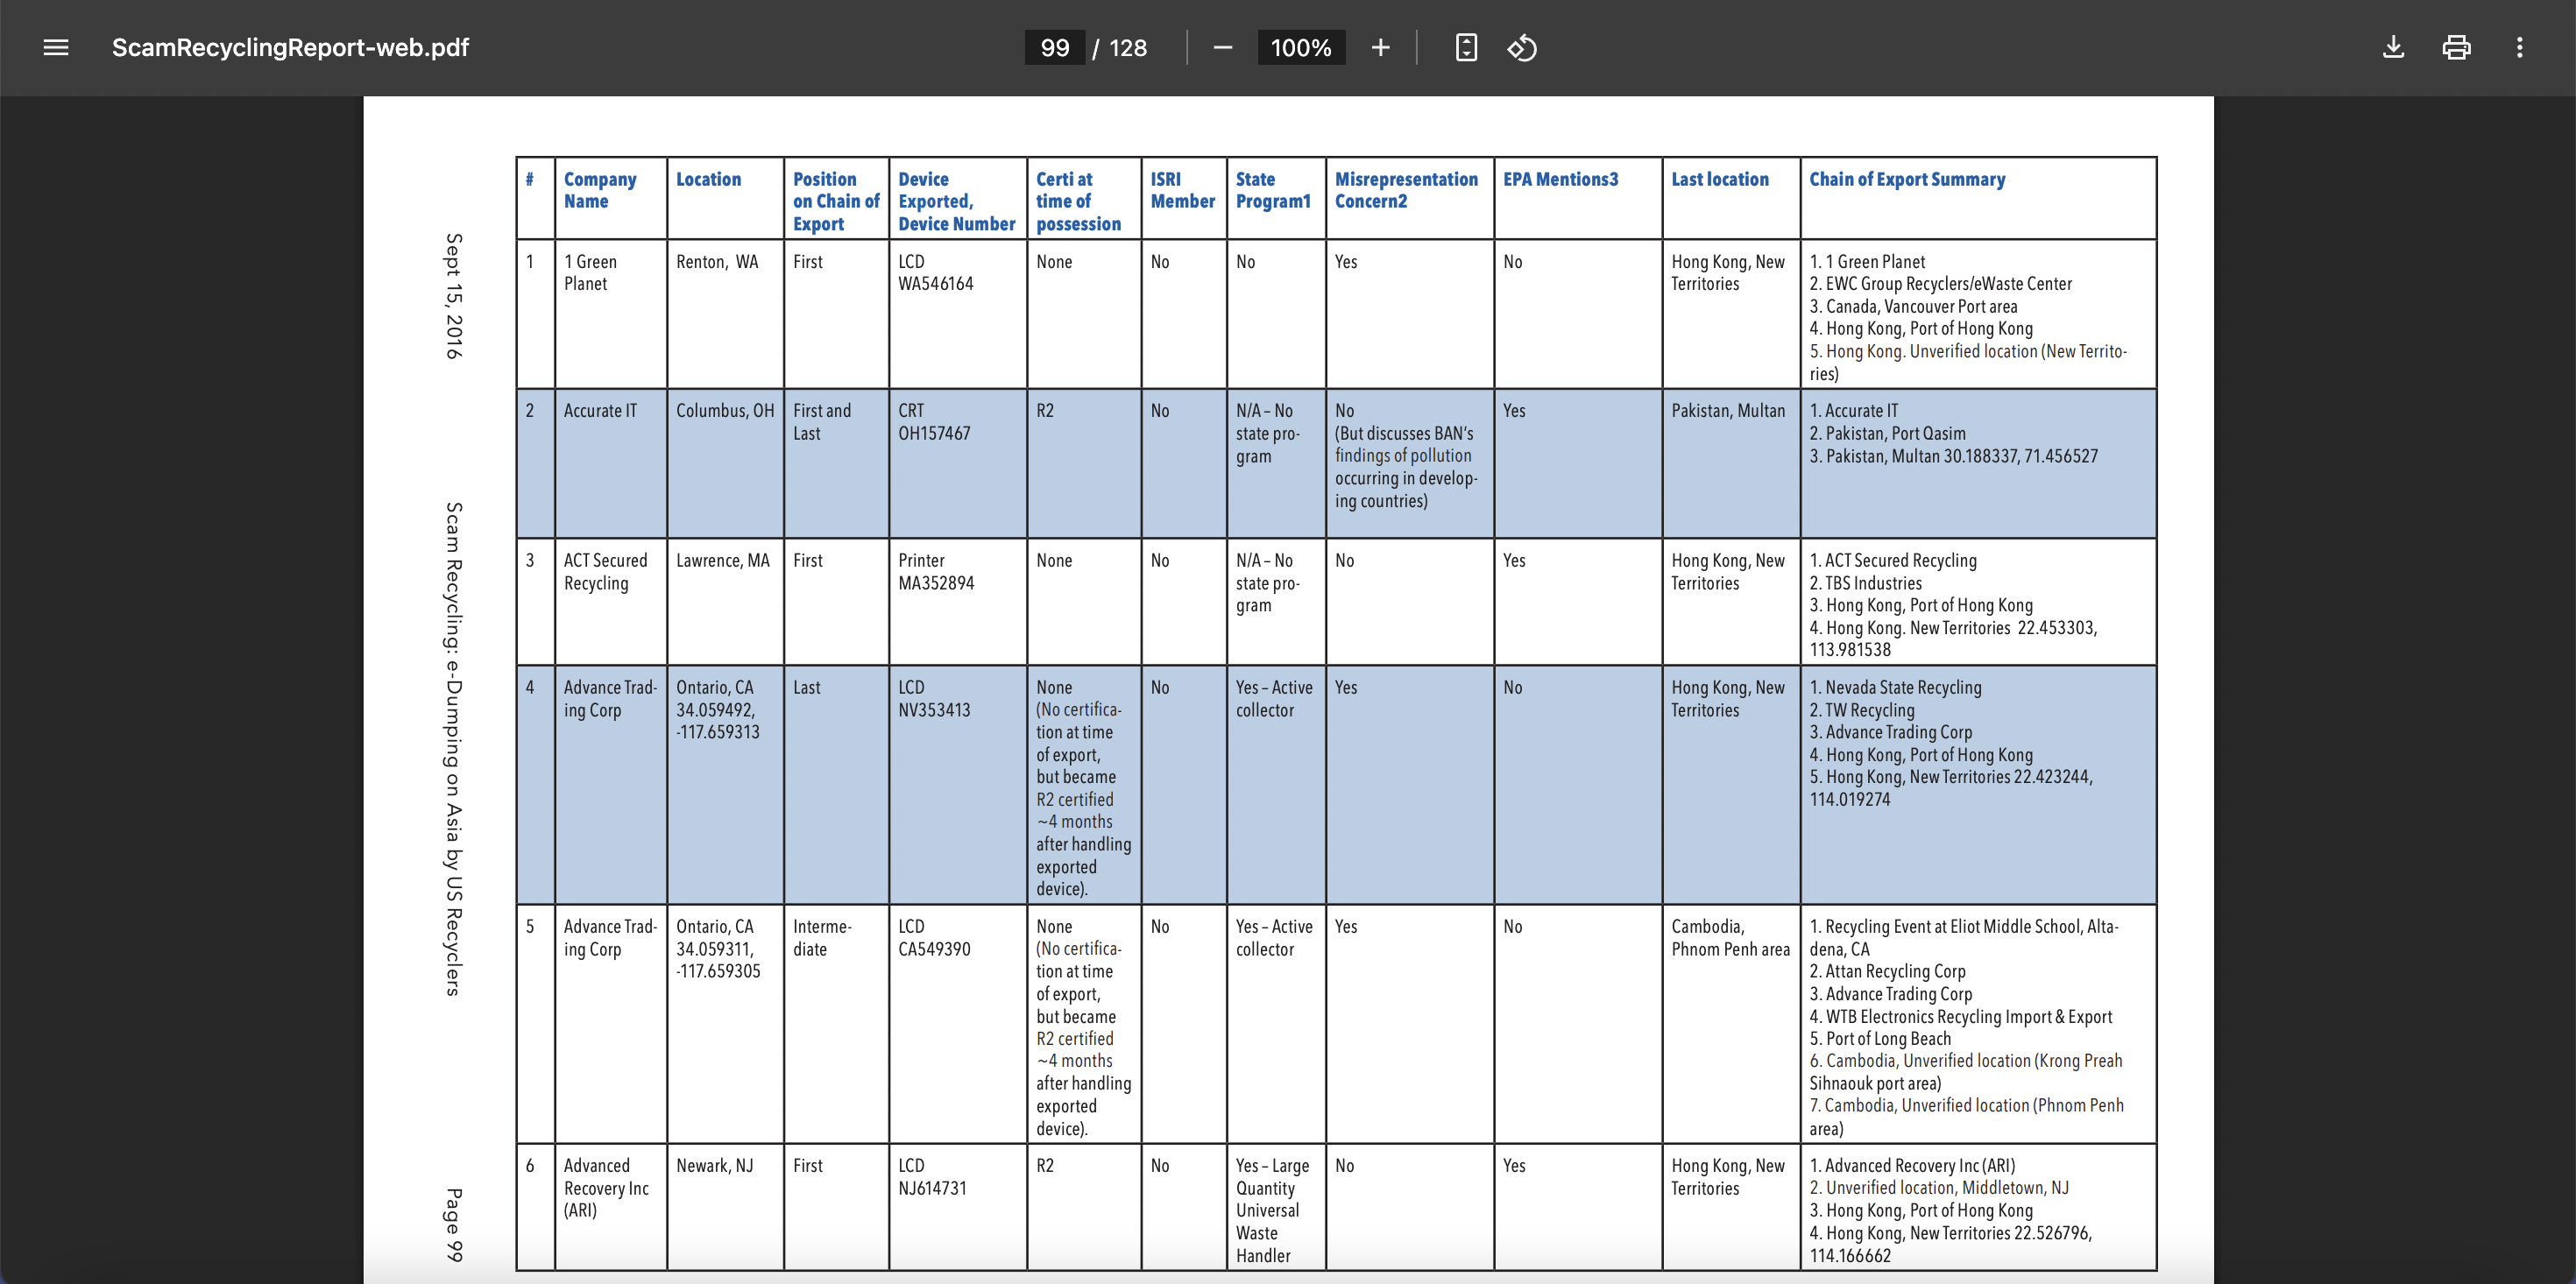
Data cleaning and processing was an intensive task due to the mostly unstructured format of the information in the PDF. First, the PDF was converted to a CSV; then, a Python script was used to split each row such that each location mentioned in the column "Chain of Export Summary" had its own separate line.
Next, geolocating all locations with specific coordinates was needed to plot the data on a map. A Python script was used to automate the process when possible and to efficiently handle the same location appearing multiple times in different rows, but due to ambiguous location names - some of which had changed over time due to business closures - I had to geolocate about 400 locations by hand, mostly using Google Maps and address book lookups.
I then wrote another Python script to convert the CSV into a GeoJSON file that would be compatible with Mapbox, the mapping library I used to create the interactive map. Inside the web interface, I used D3.js to finetune the styling of data points upon user interaction.